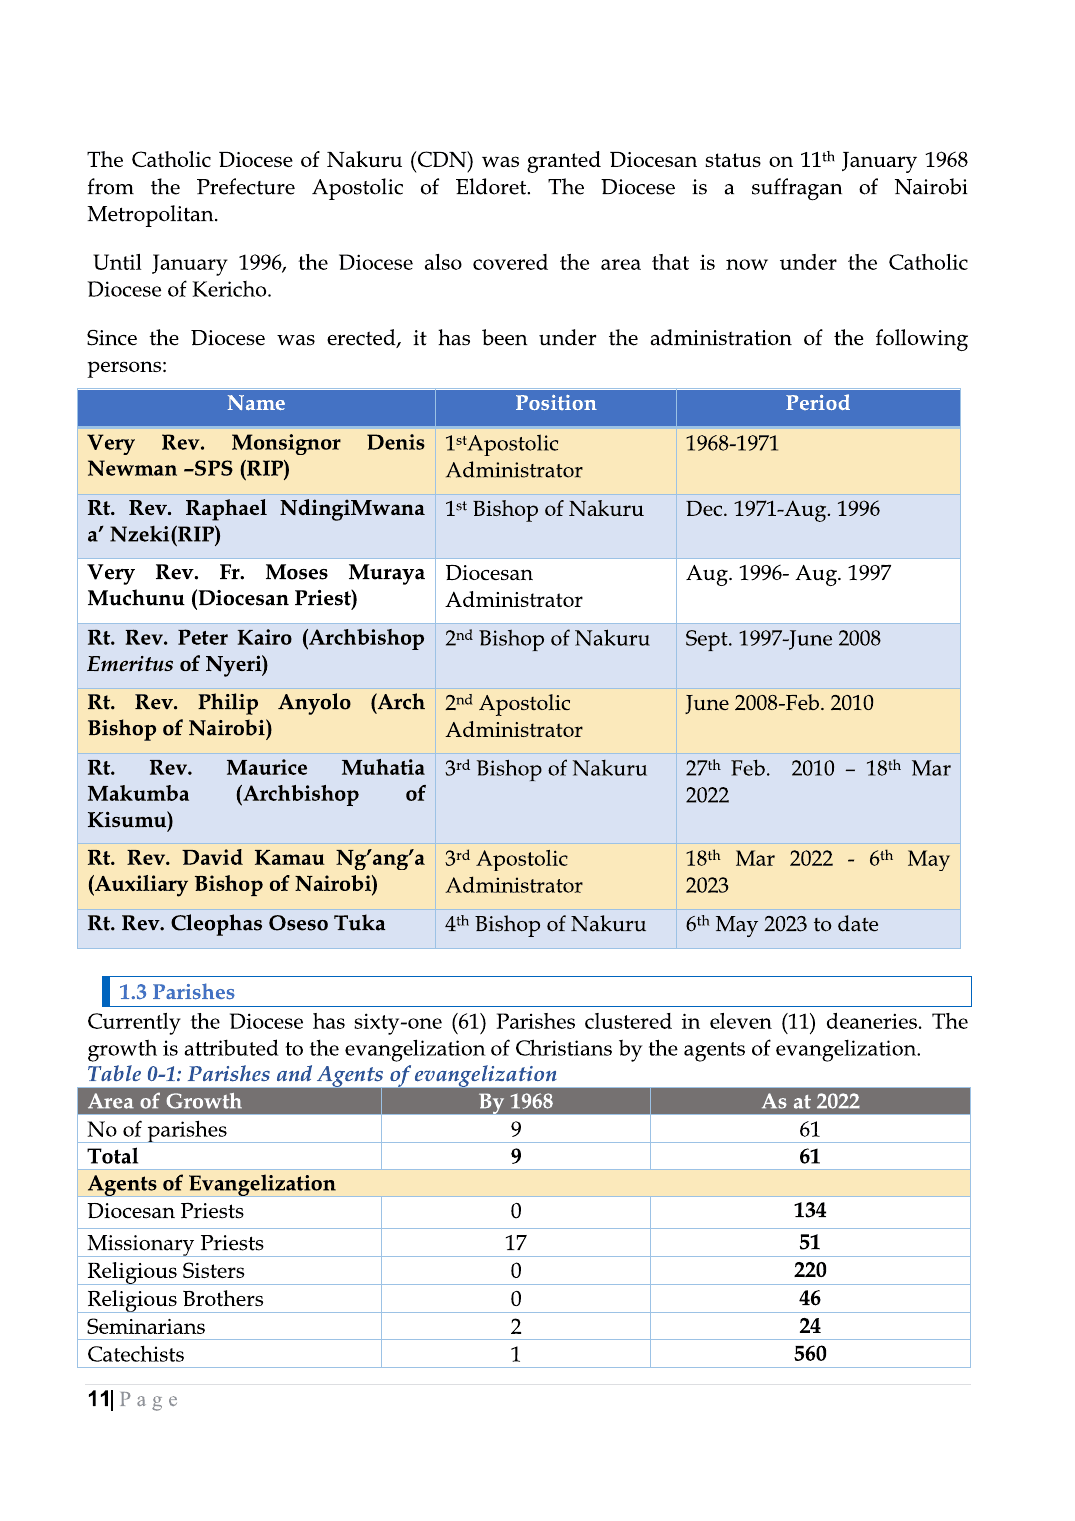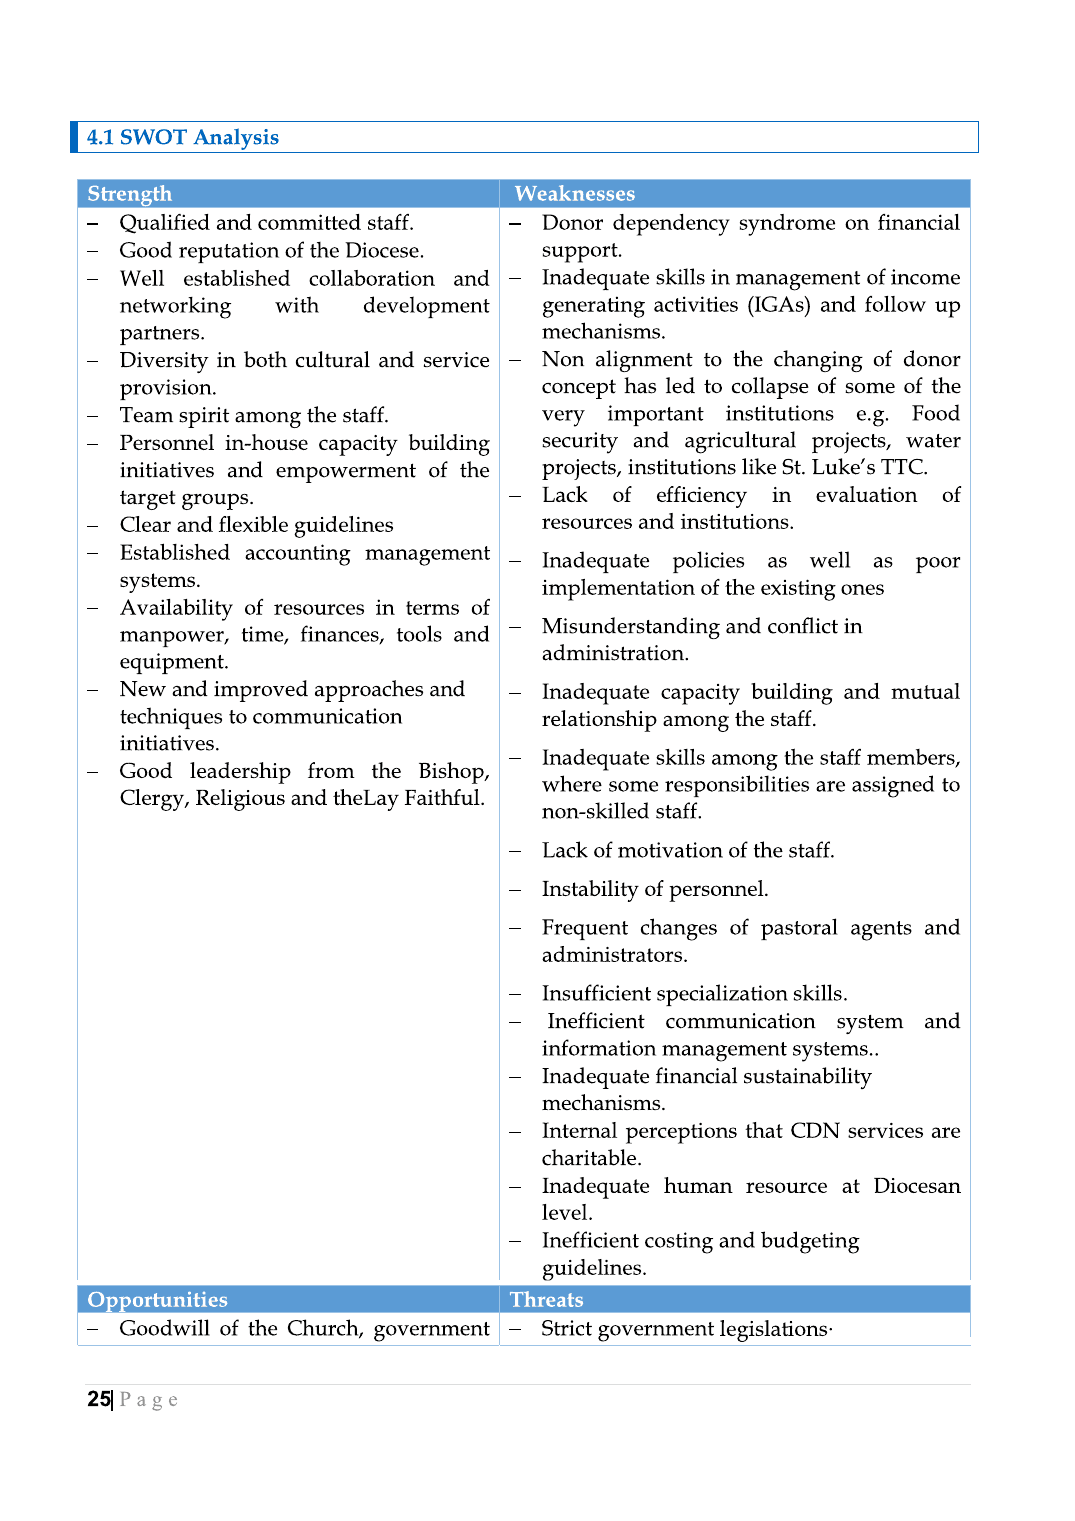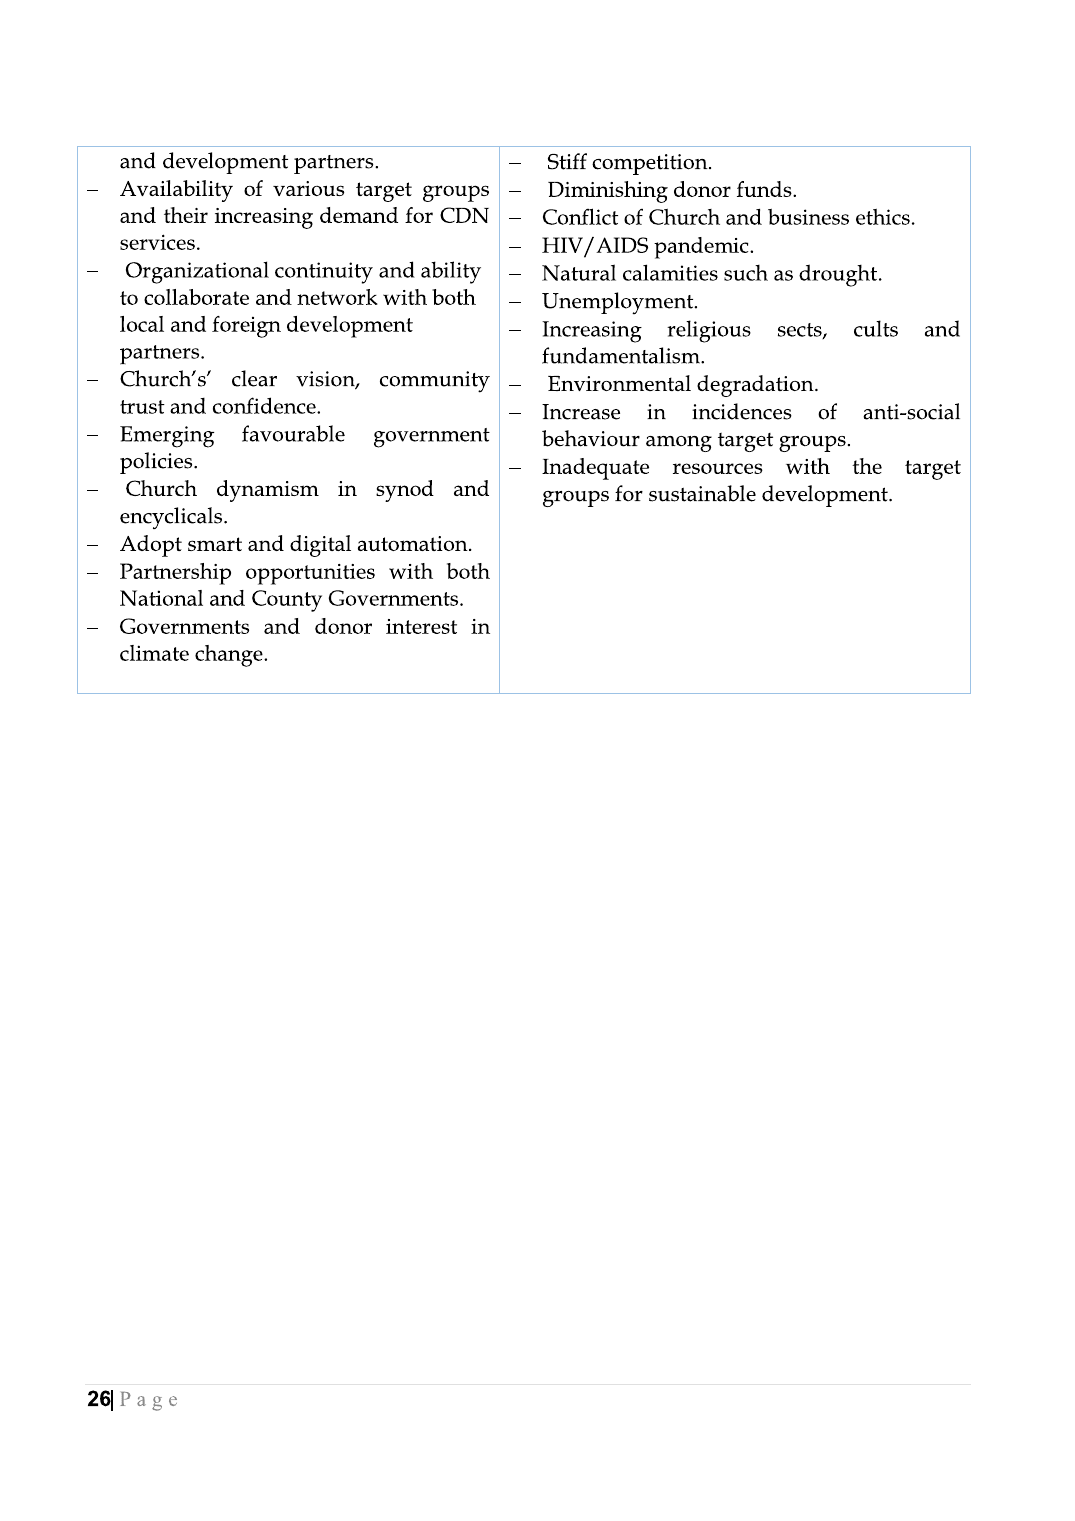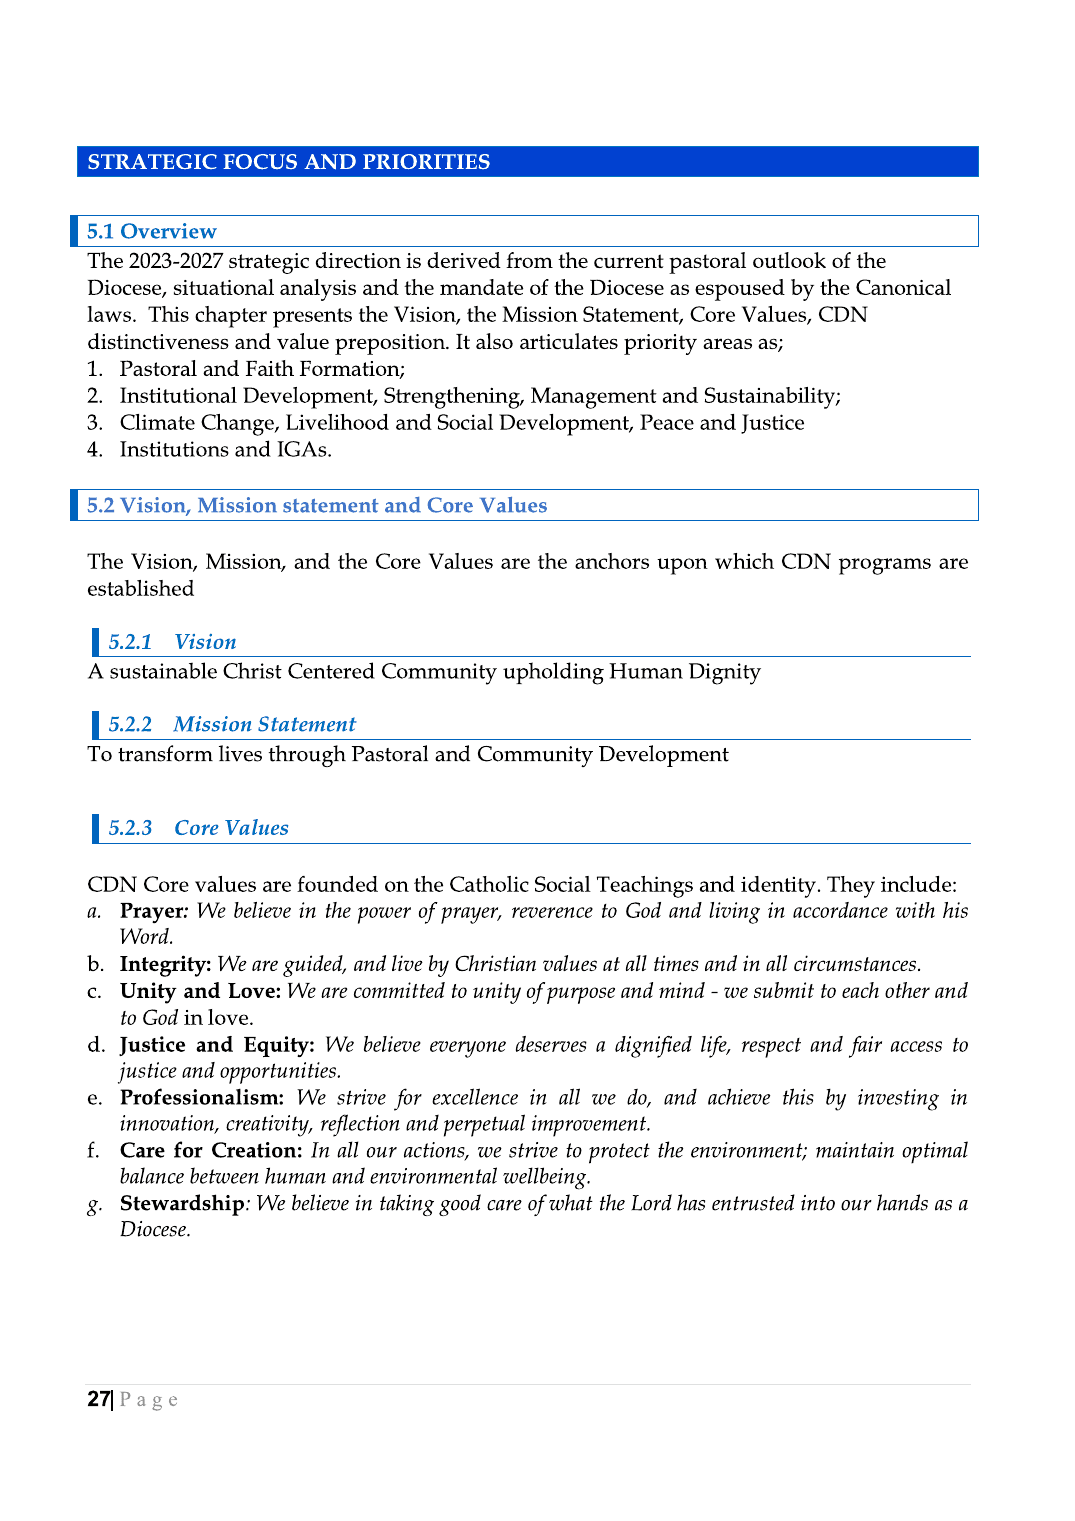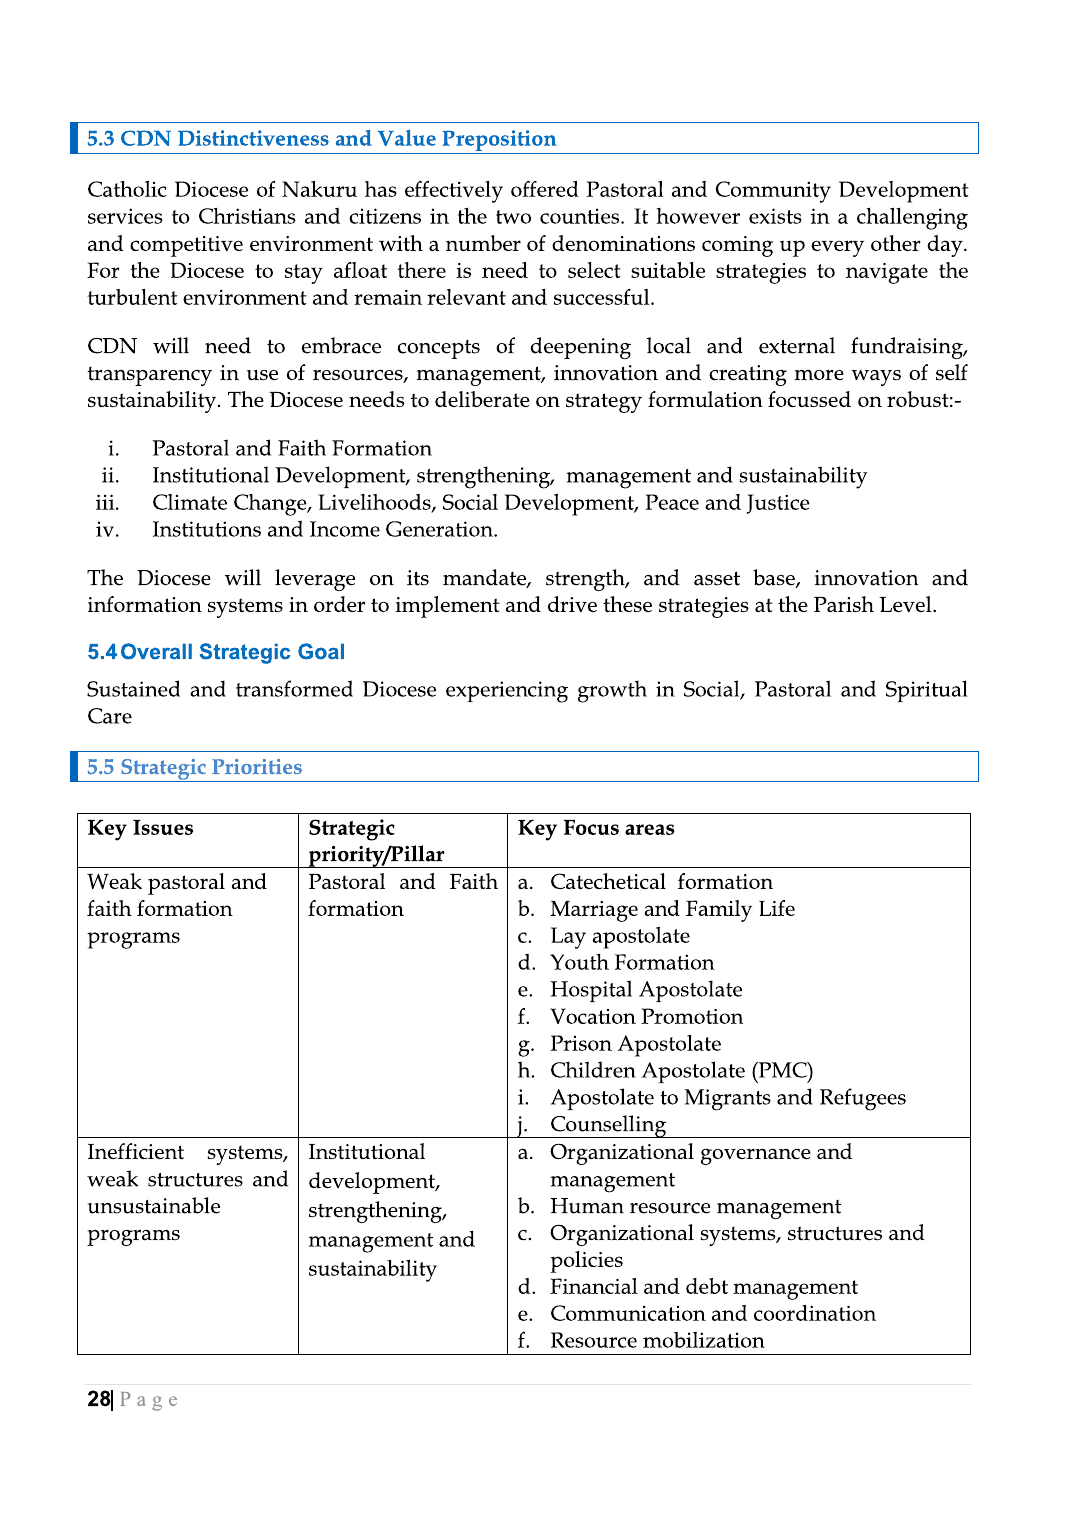
Parishes and agents of evangelization
Strategic Plan
Strategic direction for mission and service.
Explore the Diocese's pastoral priorities, institutional work, parish growth, county context, and stewardship indicators, with the original PDF available for download.
Strategic Plan statistics
Core diocesan figures for planning and service visibility.
KES 969,397,538
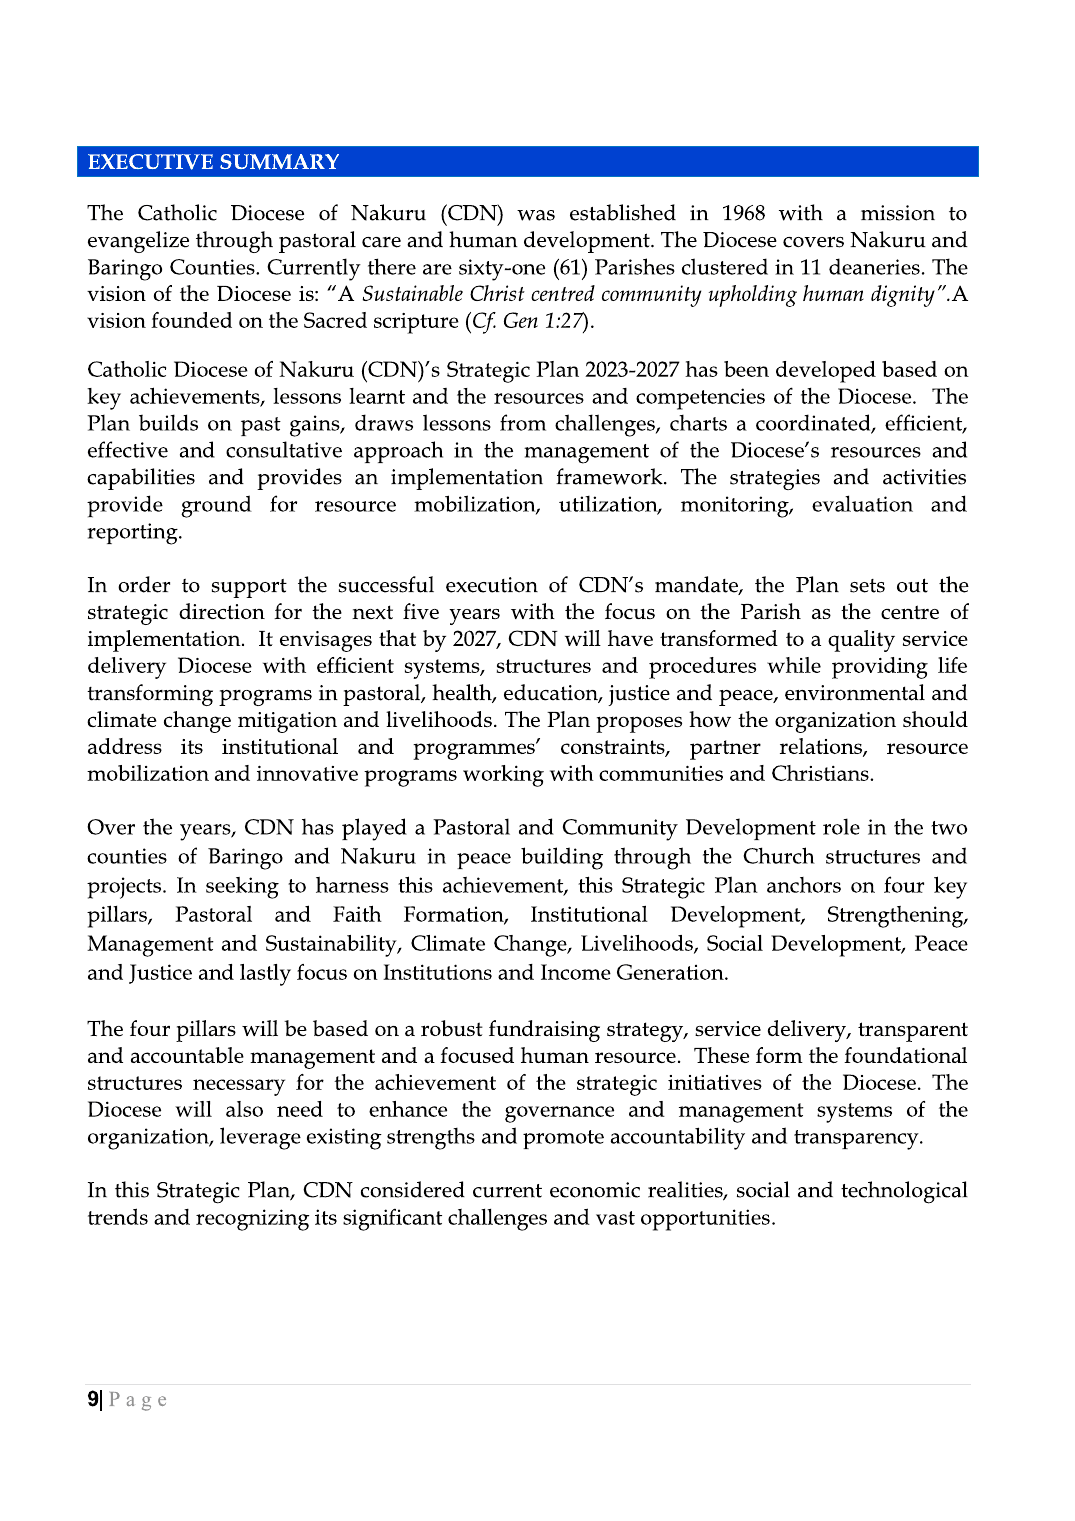
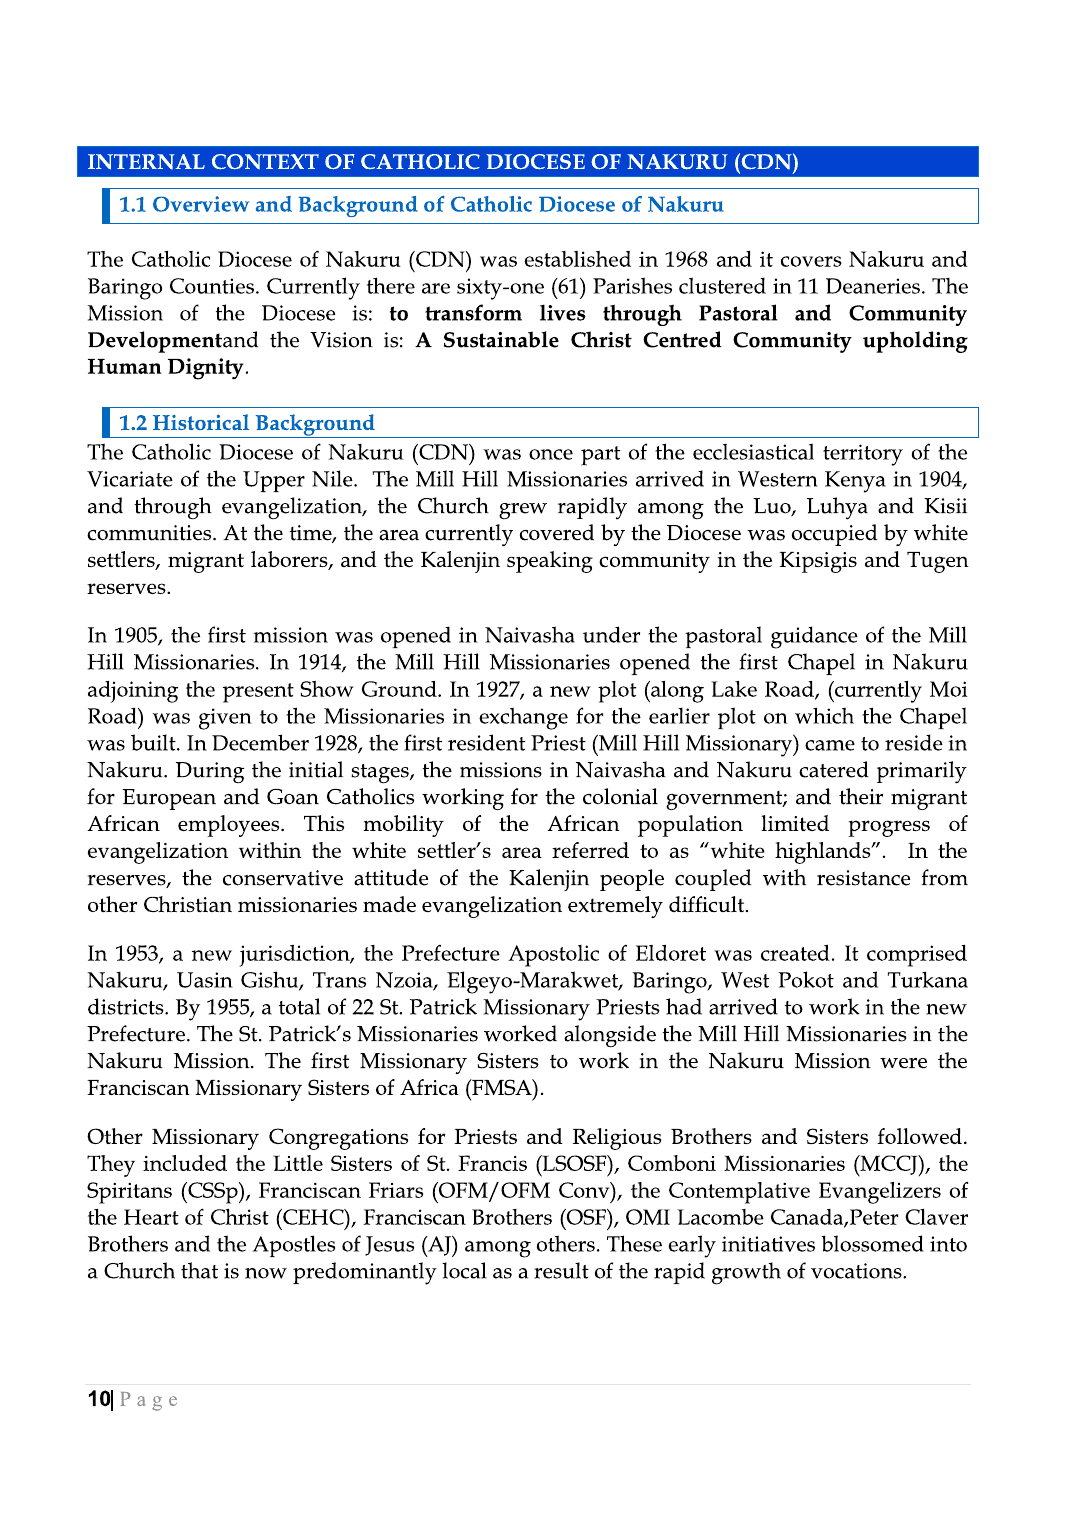
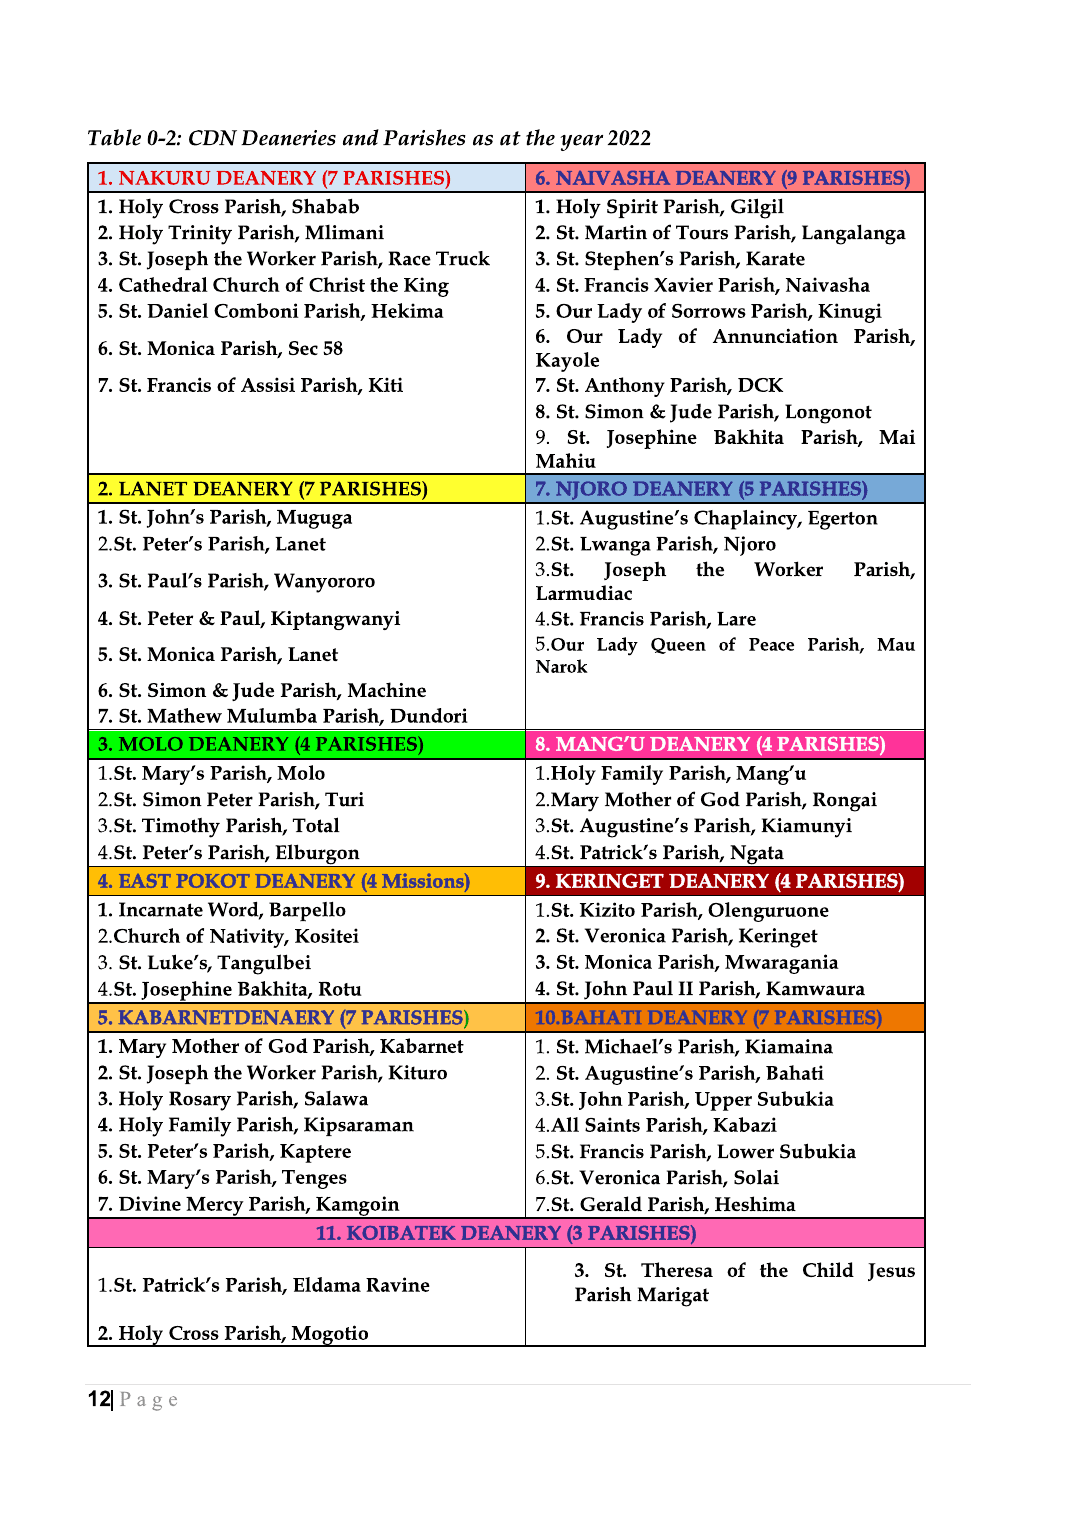
61
Parishes
Clustered in 11 deaneries as at 2022.
11
Deaneries
Pastoral units listed in the Strategic Plan parish table.
4
Departments
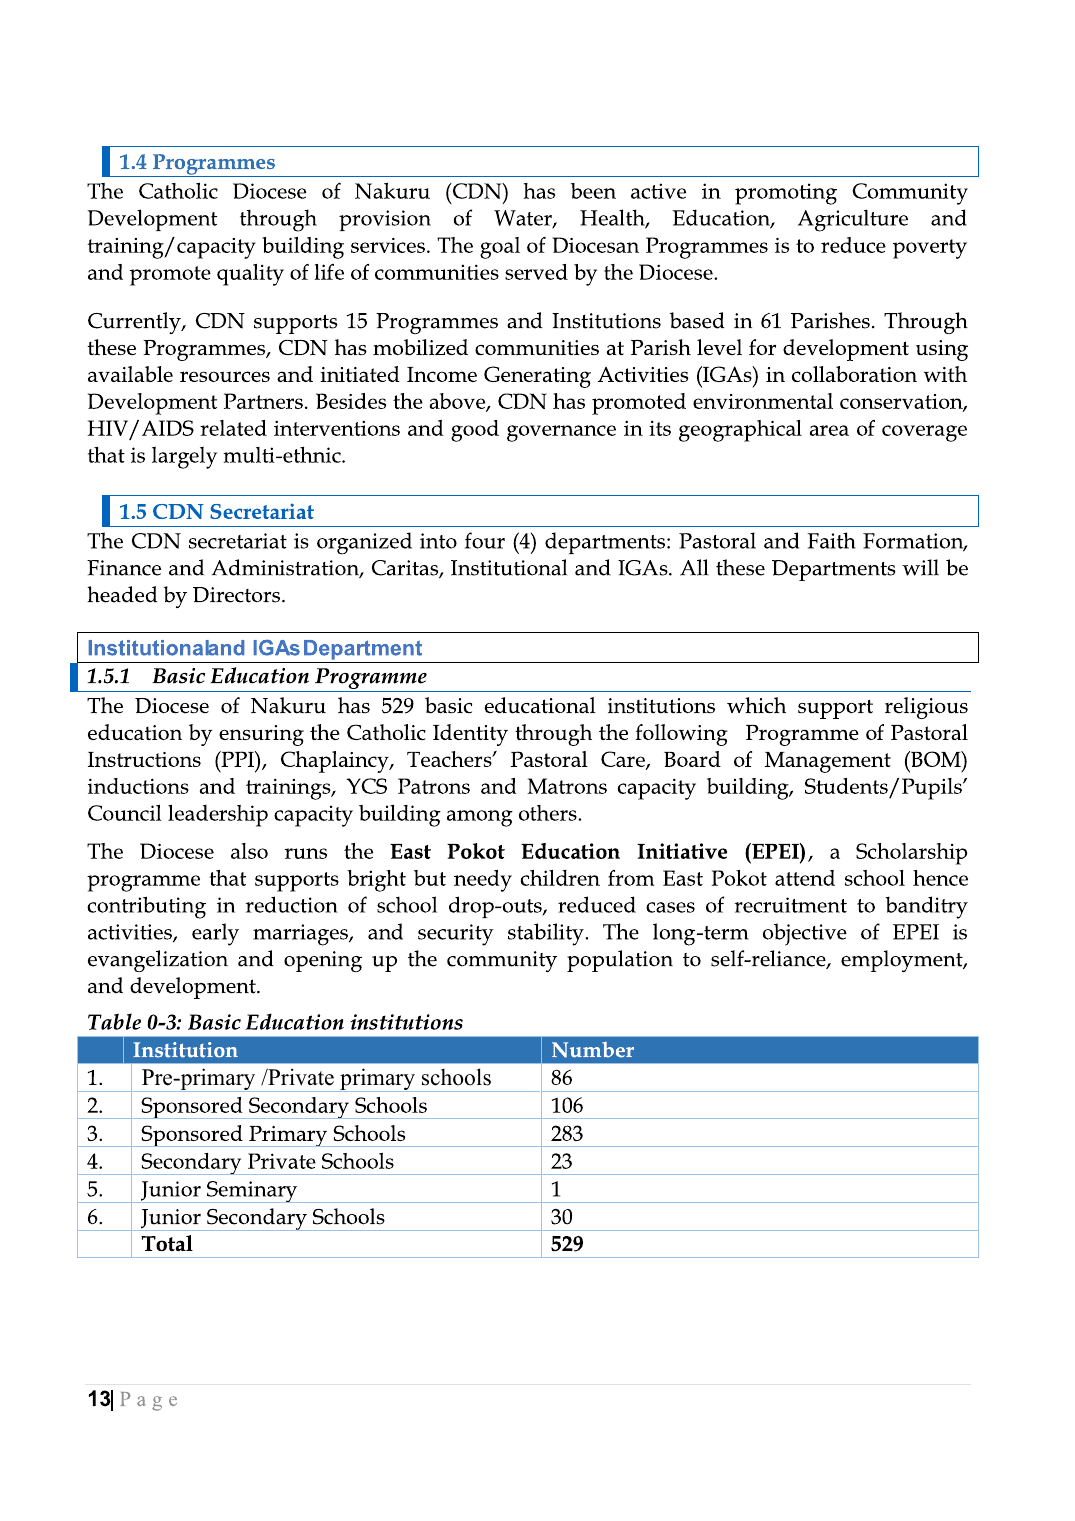
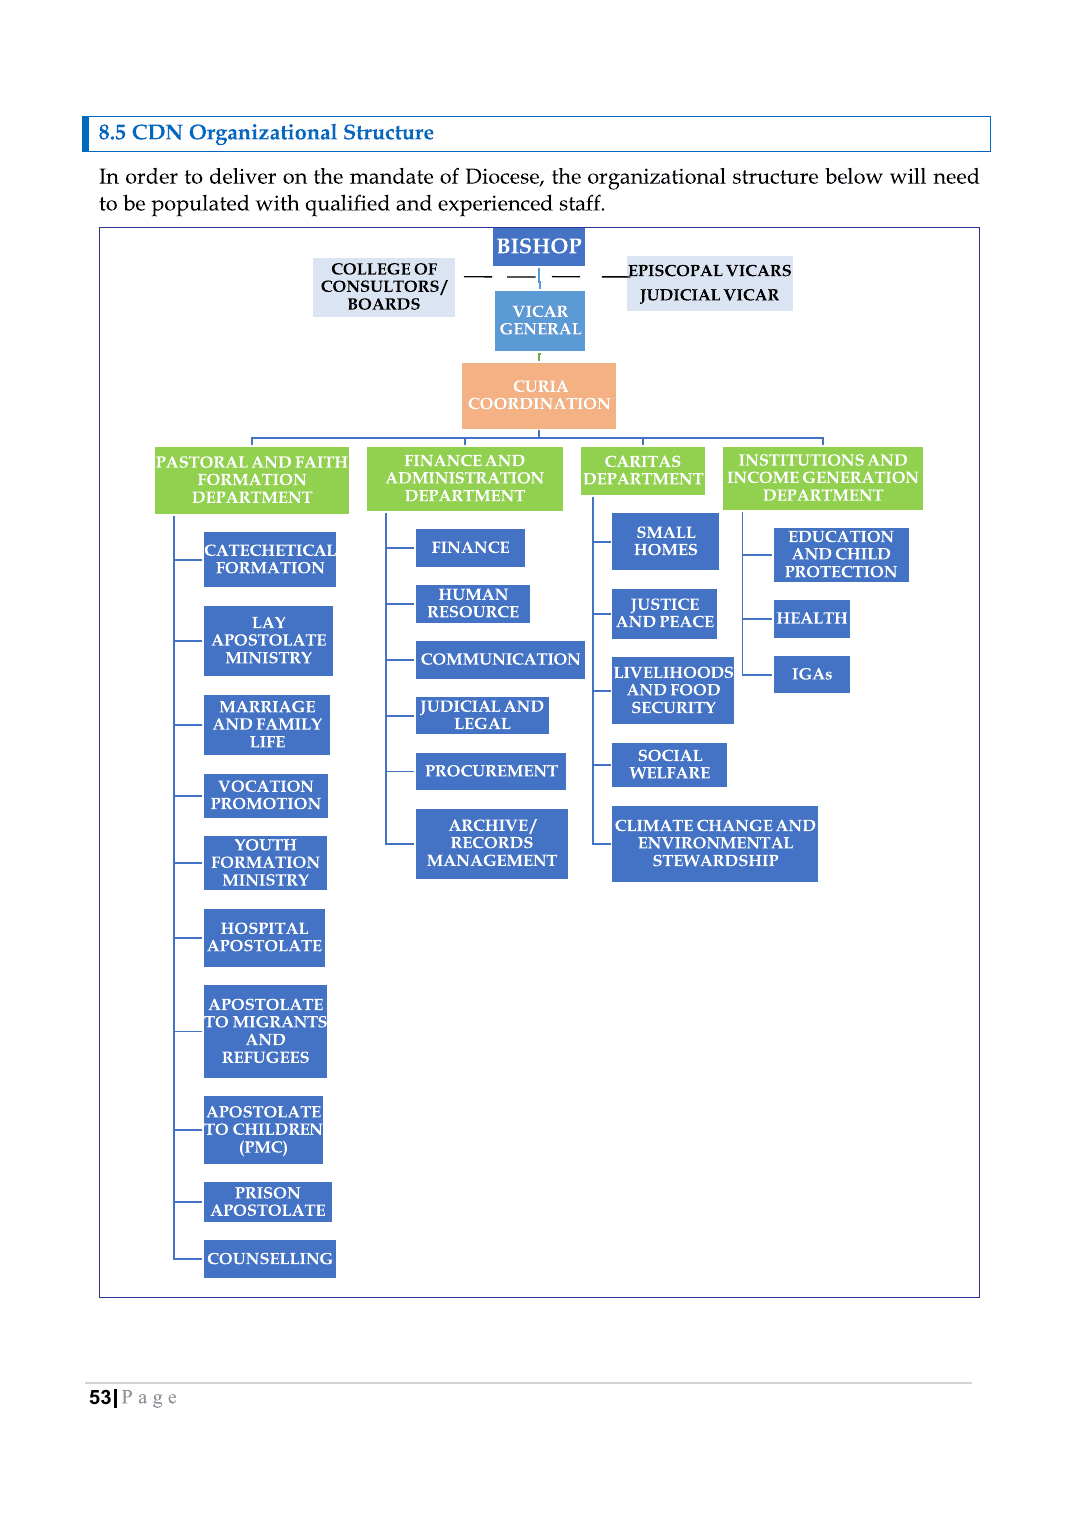
Pastoral and Faith Formation, Finance and Administration, Caritas, and Institutional and IGAs.
15
Programmes and institutions
Programmes and institutions based in 61 parishes.
529
Basic education institutions
Pre-primary, primary, secondary, junior secondary, and junior seminary institutions.
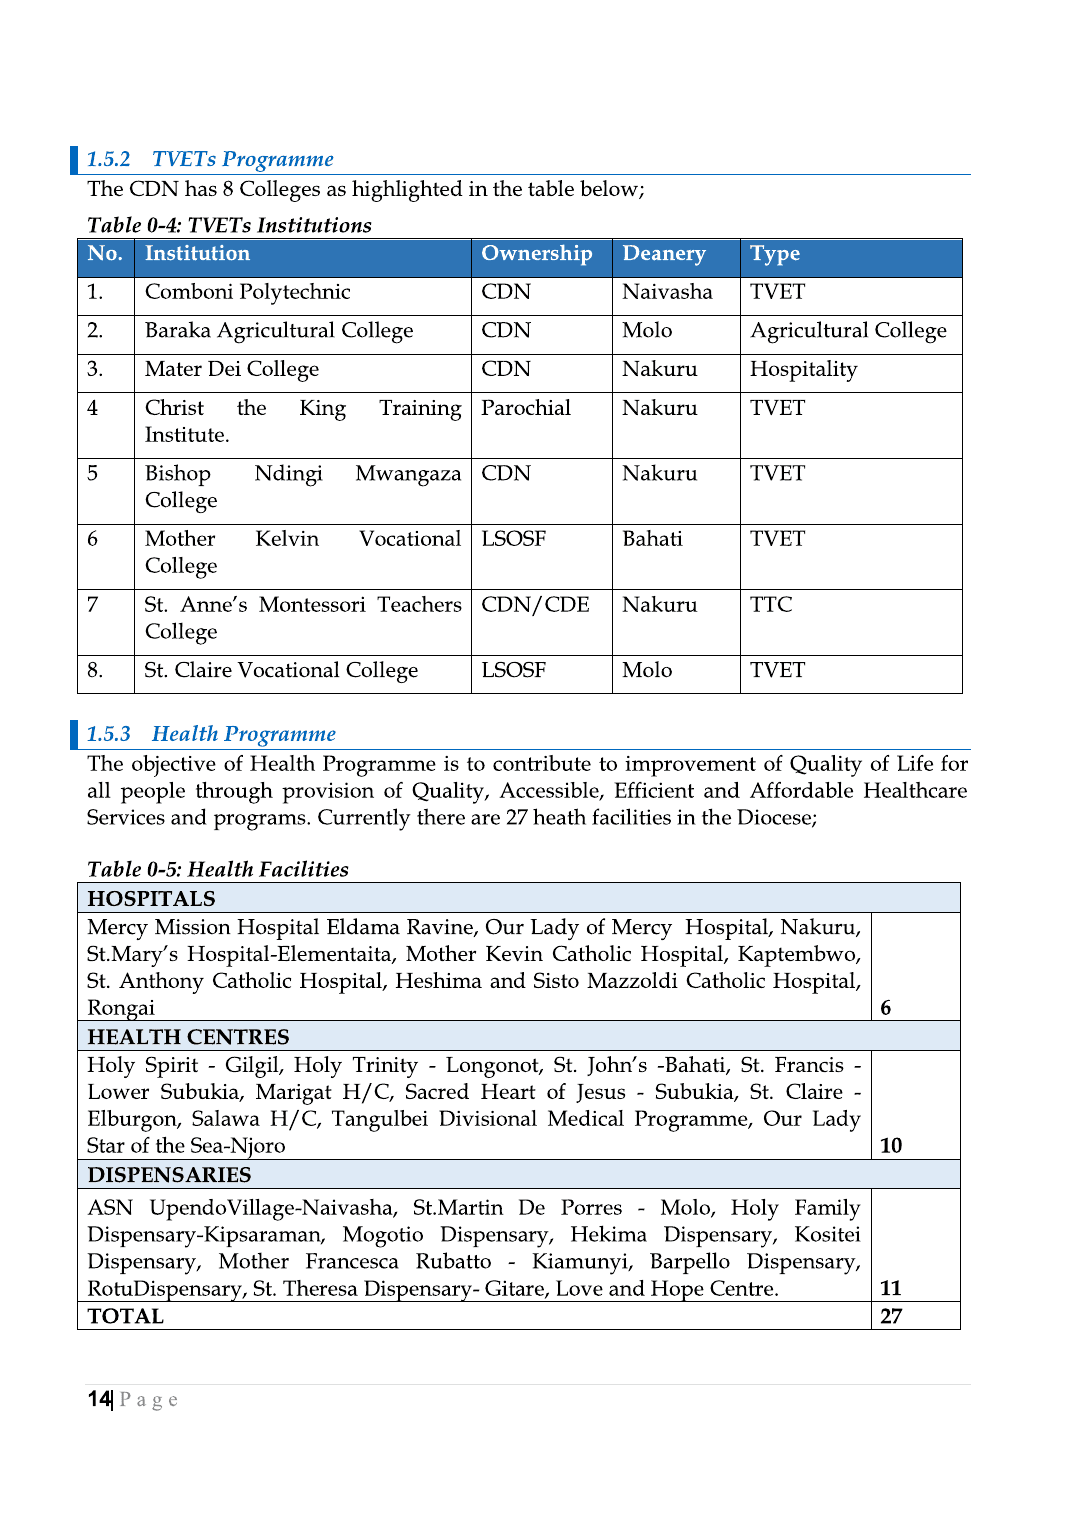
8
TVET and college institutions
Colleges and technical/vocational institutions listed in the plan.
27
Health facilities
Six hospitals, ten health centres, and eleven dispensaries.
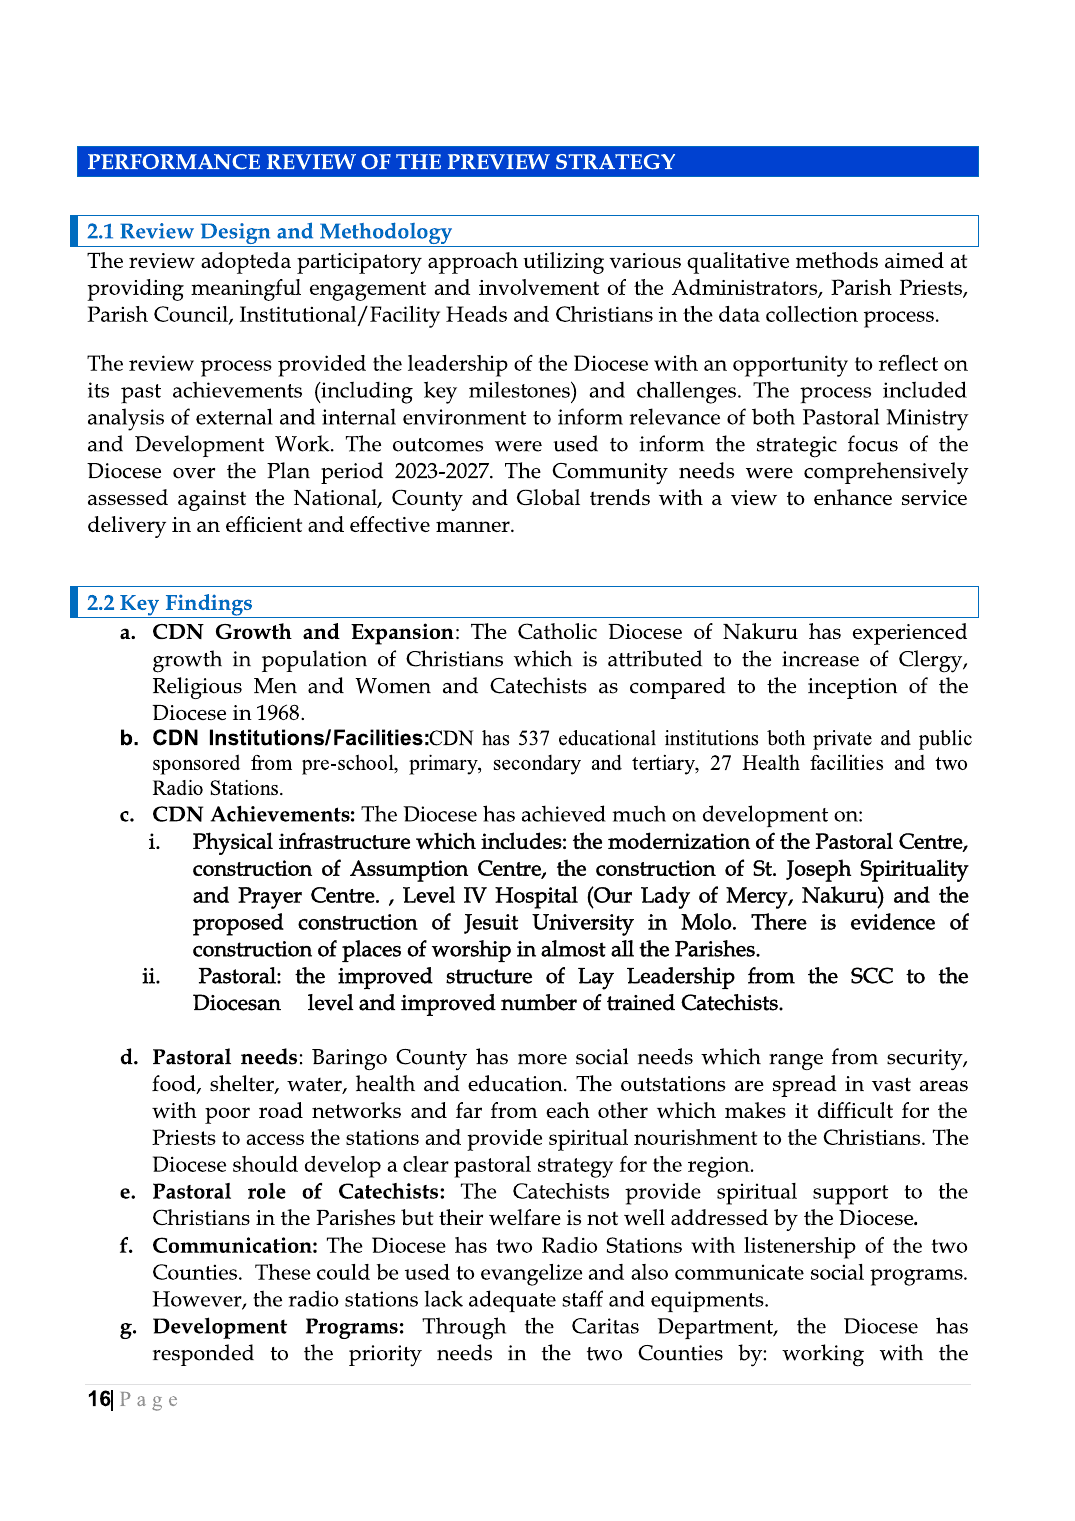
2
Radio stations
Referenced in the institutional/facilities findings.
2.83M
Population in counties served
Nakuru and Baringo county population totals from the 2019 census figures cited in the plan.
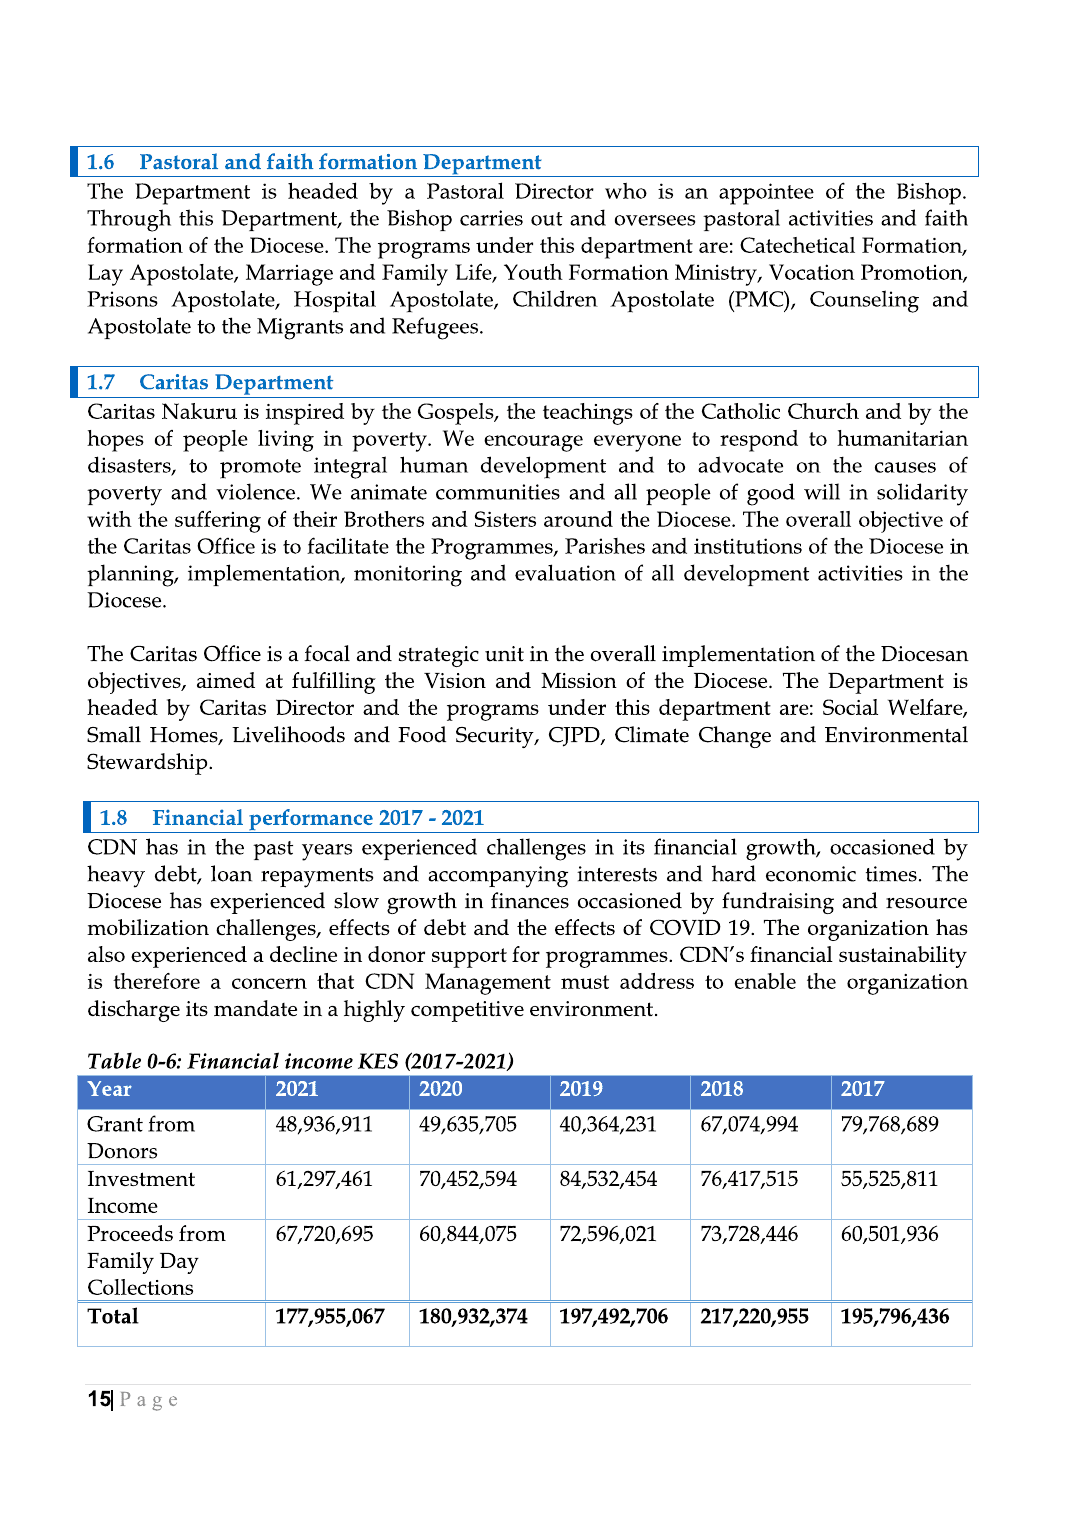
KES 969.4M
Five-year income reviewed
Total reported financial income across 2017-2021.
Institutions and health facilities
86
Pre-primary / Private primary schools
106
Sponsored secondary schools
283
Sponsored primary schools
23
Secondary private schools
1
Junior seminary
30
Junior secondary schools
6
Hospitals
10
Health centres
11
Dispensaries
TVET: Comboni Polytechnic, Baraka Agricultural College, Mater Dei College, Christ the King Training Institute, Bishop Ndingi Mwangaza College, Mother Kelvin Vocational College, St. Anne's Montessori Teachers College, St. Claire Vocational College.
Population context
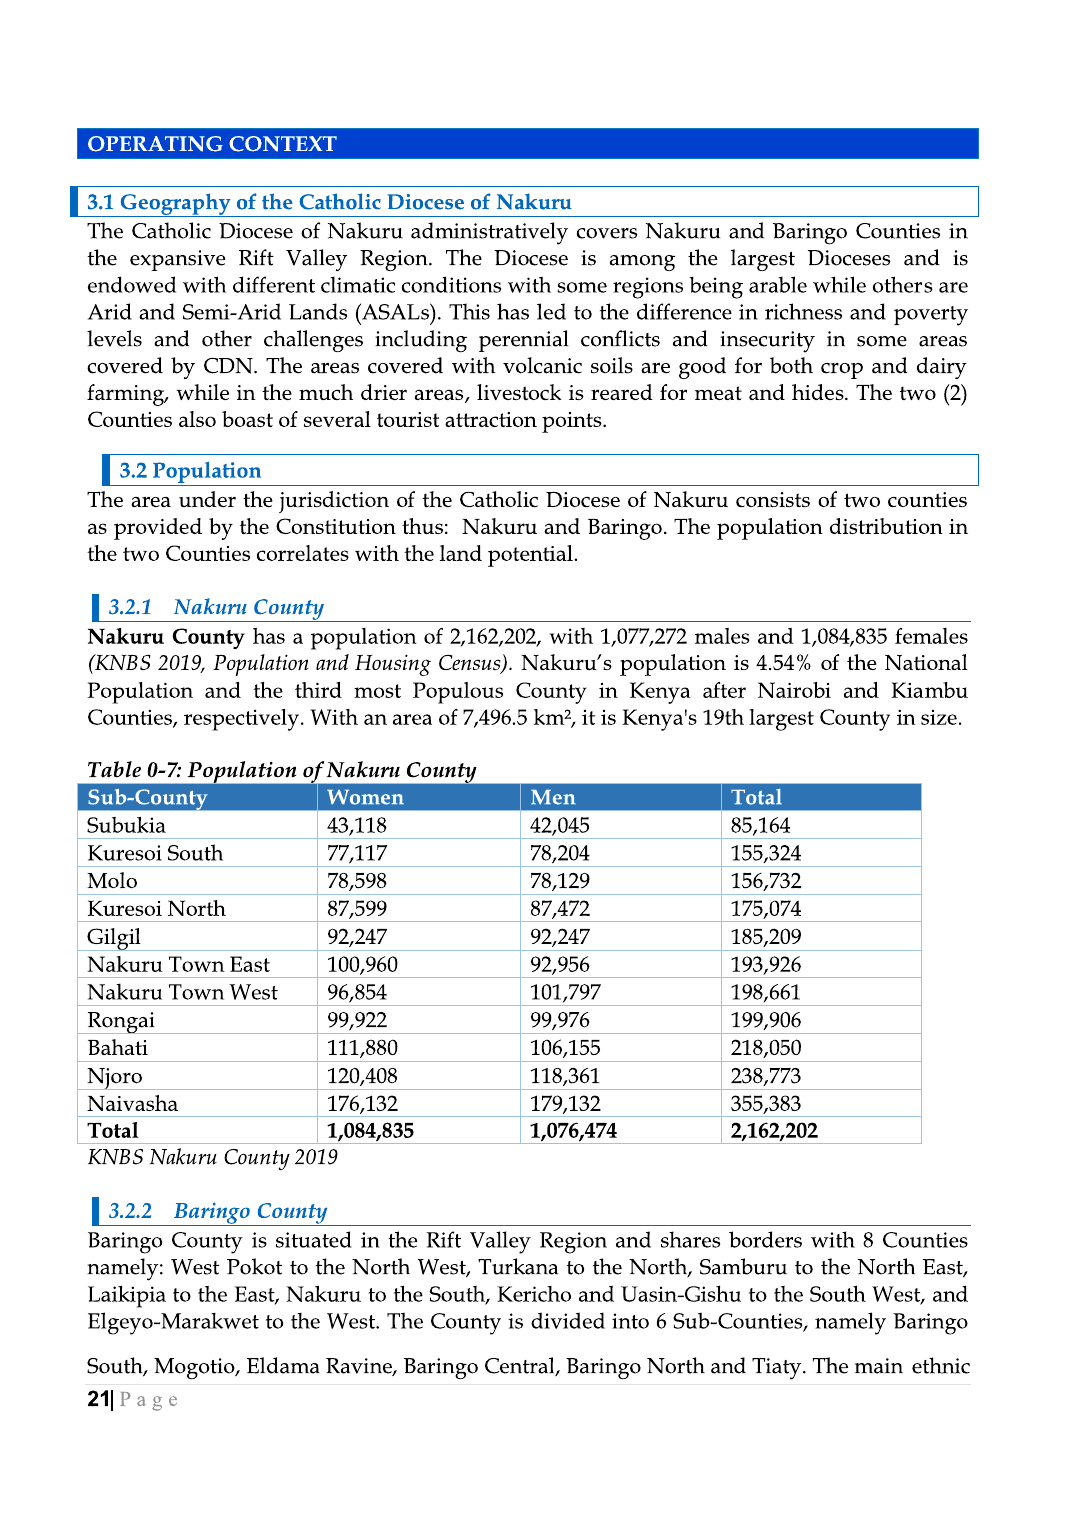
2,162,202
Nakuru County
Cited from KNBS 2019 Population and Housing Census; the plan notes Nakuru's population as 4.54% of the national population.
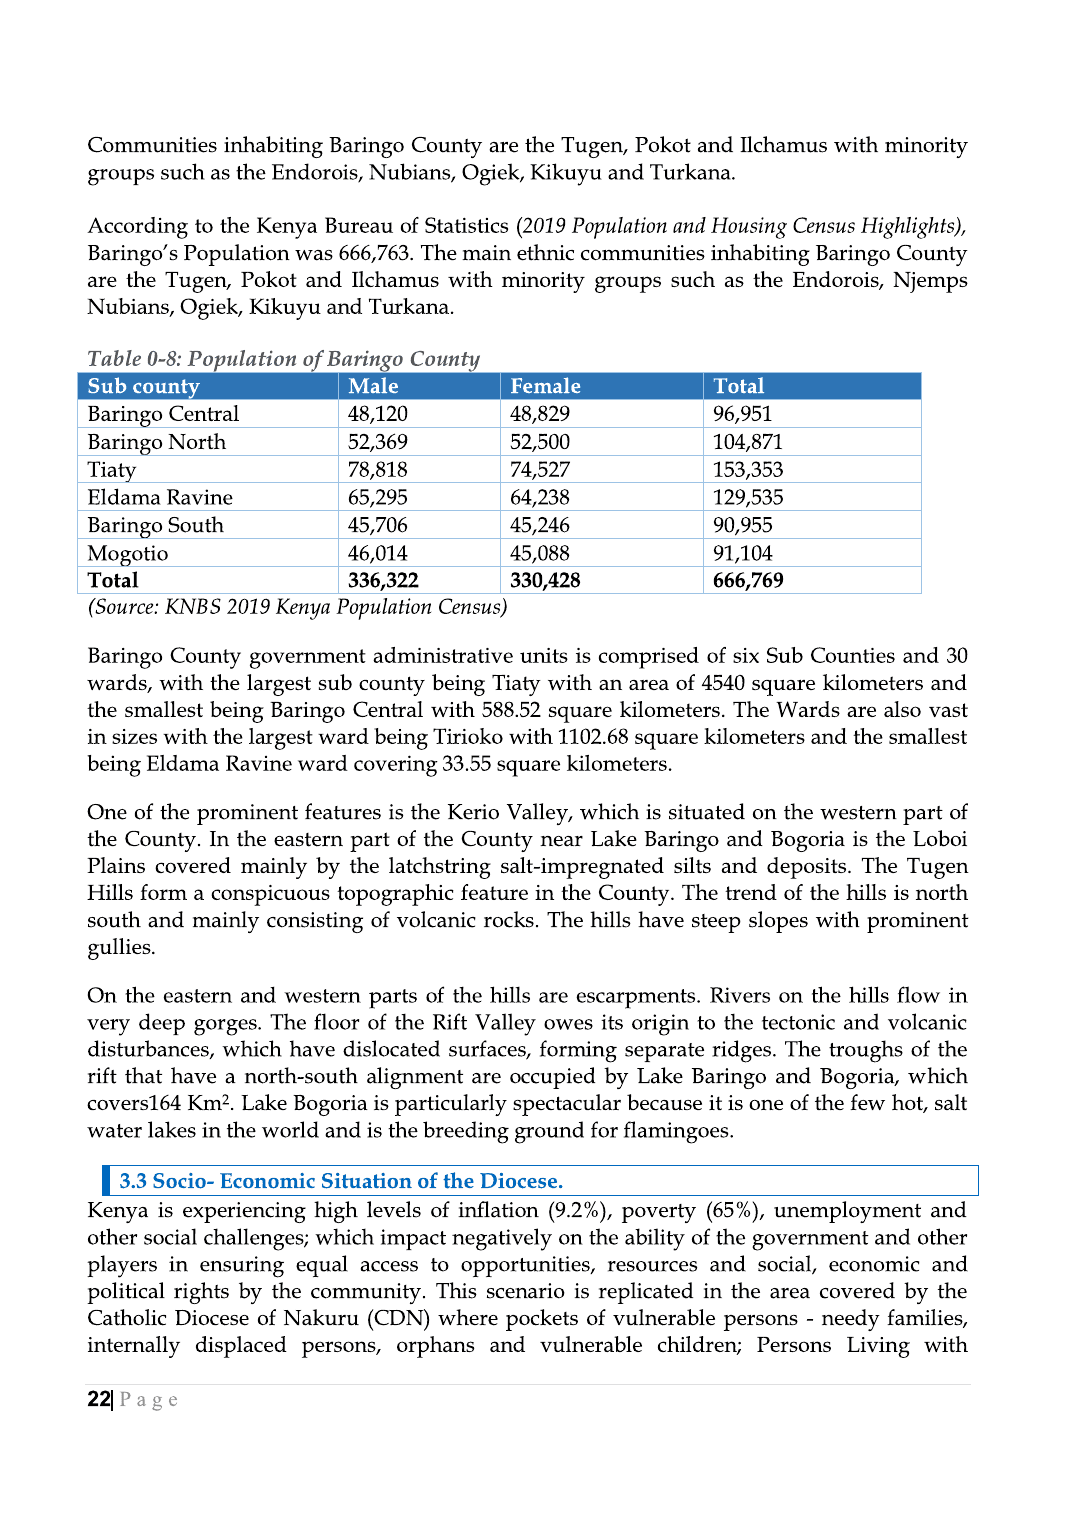
666,769
Baringo County
Cited from KNBS 2019 Kenya Population Census; the plan identifies six sub-counties and 30 wards.
Financial income 2017-2021
| Income stream | 2021 | 2020 | 2019 | 2018 | 2017 |
|---|---|---|---|---|---|
| Grant from donors | 48,936,911 | 49,635,705 | 40,364,231 | 67,074,994 | 79,768,689 |
| Investment income | 61,297,461 | 70,452,594 | 84,532,454 | 76,417,515 | 55,525,811 |
| Proceeds from Family Day Collections | 67,720,695 | 60,844,075 | 72,596,021 | 73,728,446 | 60,501,936 |
| Total | 177,955,067 | 180,932,374 | 197,492,706 | 217,220,955 | 195,796,436 |
Plan resources
Original plan document available for review.
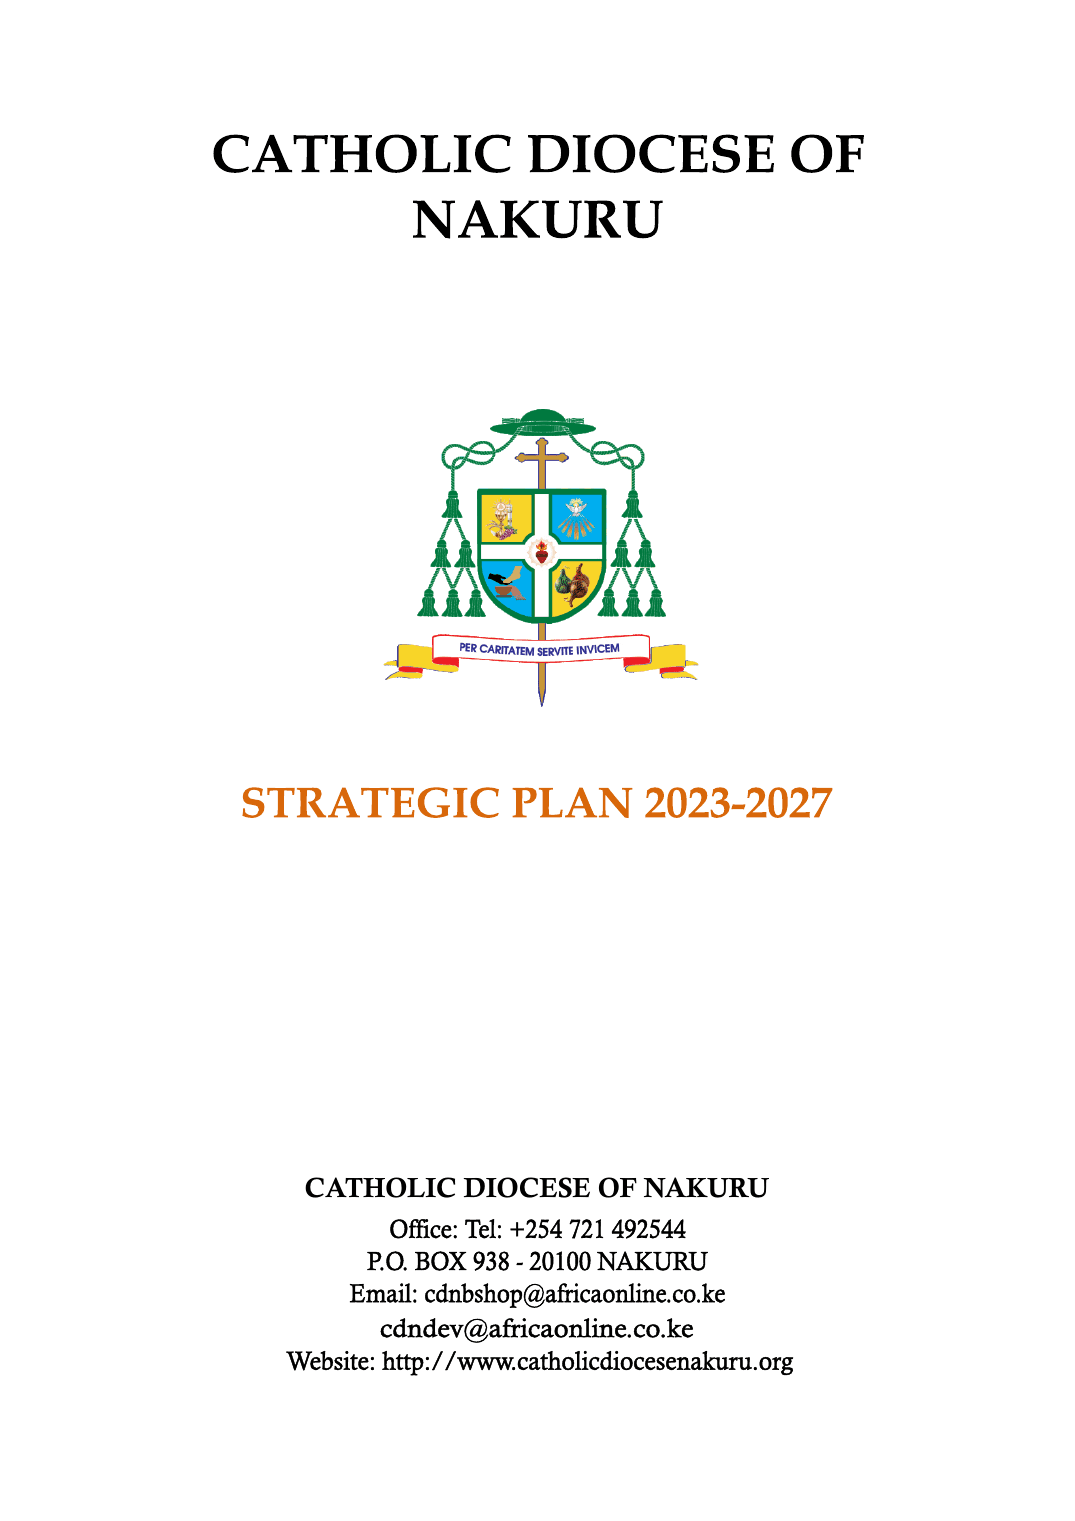
Page 1
Open image
Page 2
Open image
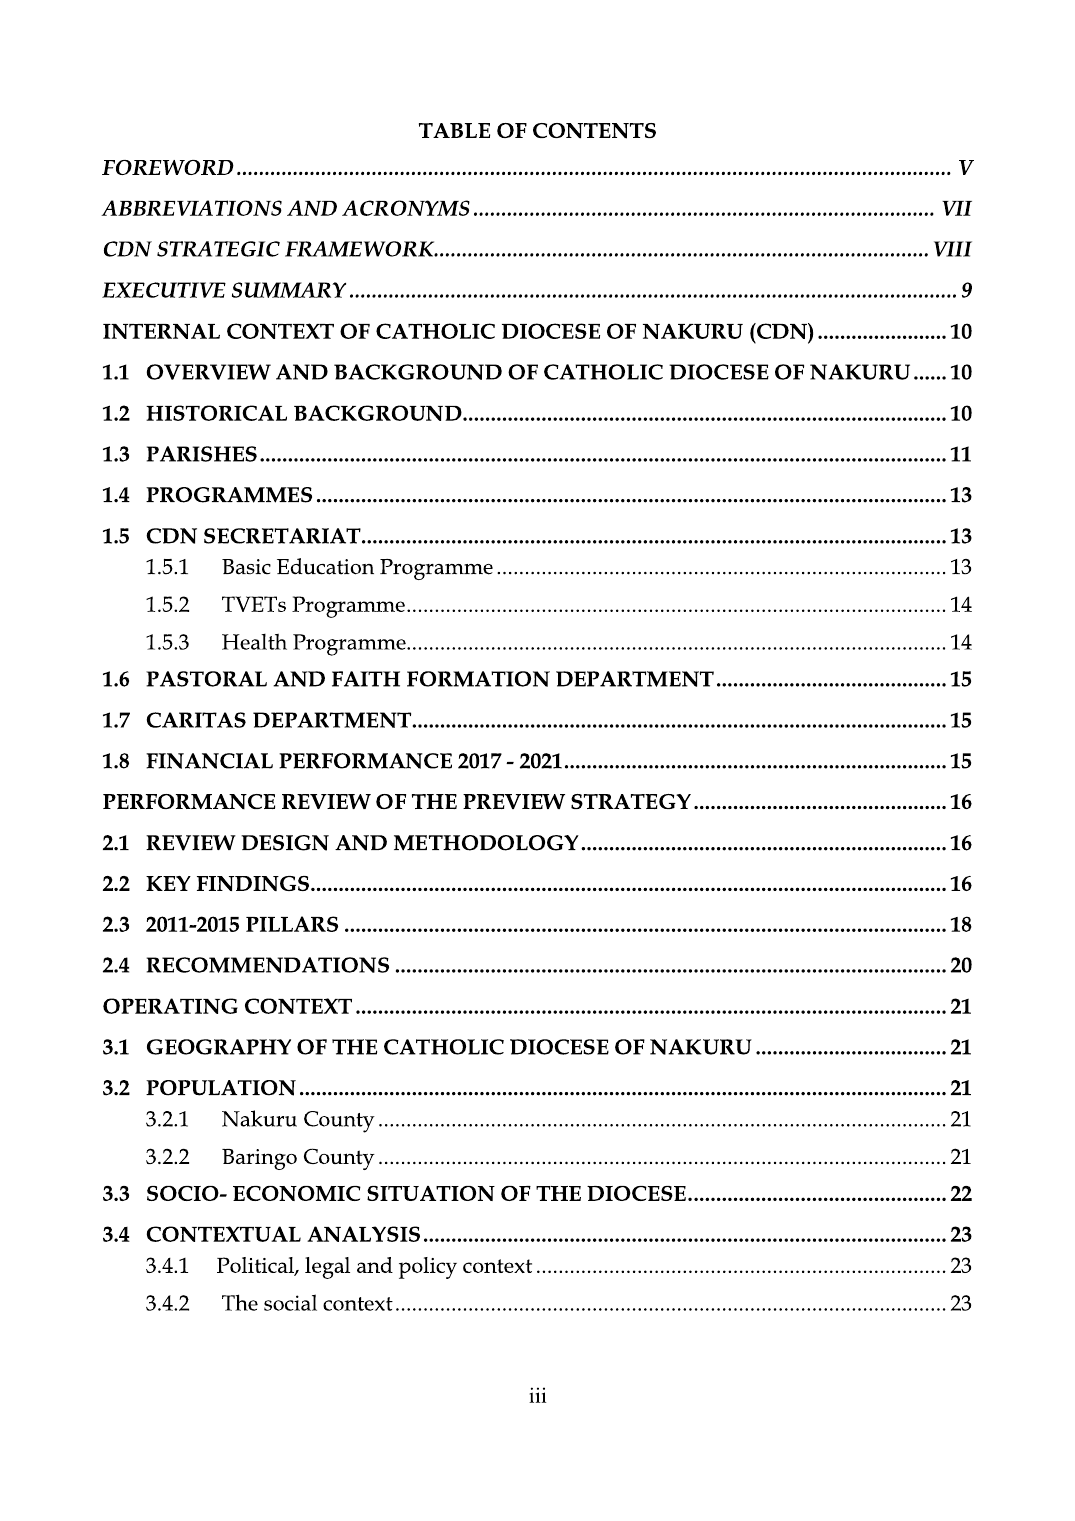
Page 3
Open image
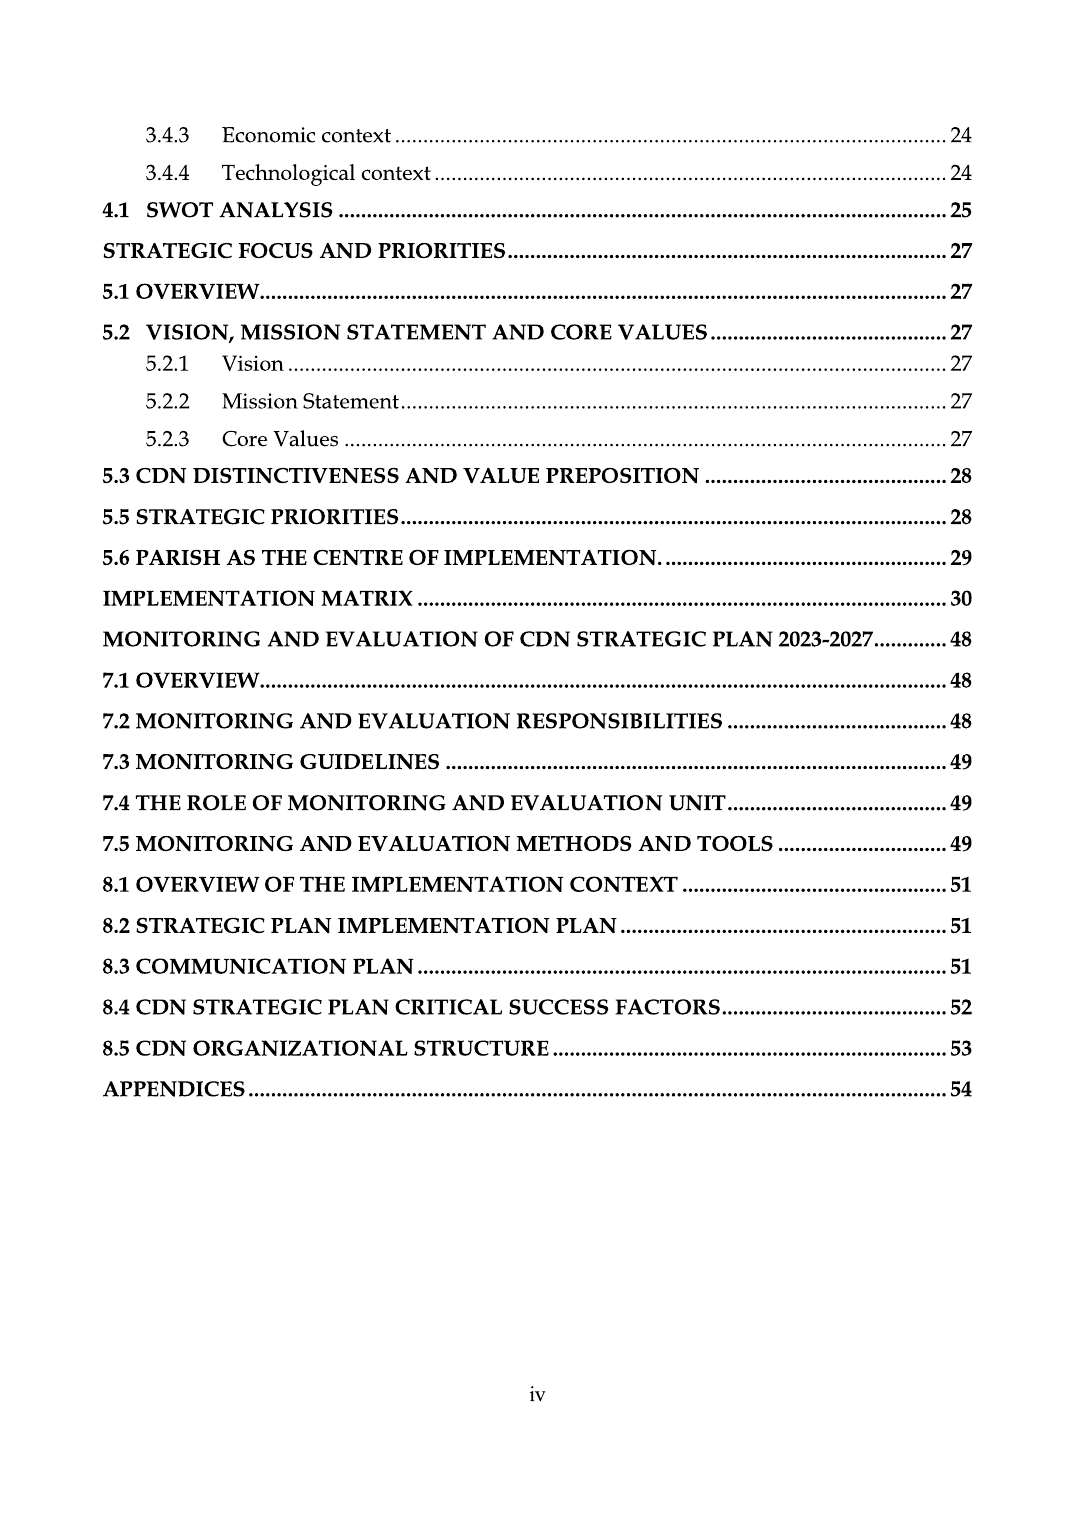
Page 4
Open image
Page 5
Open image
Page 6
Open image
Page 7
Open image
Page 8
Open image
Page 9
Open image
Page 10
Open image
Page 11
Open image
Page 12
Open image
Page 13
Open image
Page 14
Open image
Page 15
Open image
Page 16
Open image
Page 17
Open image
Page 18
Open image
Page 19
Open image
Page 20
Open image
Page 21
Open image
Page 22
Open image
Page 23
Open image
Page 24
Open image
Page 25
Open image
Page 26
Open image
Page 27
Open image
Page 28
Open image
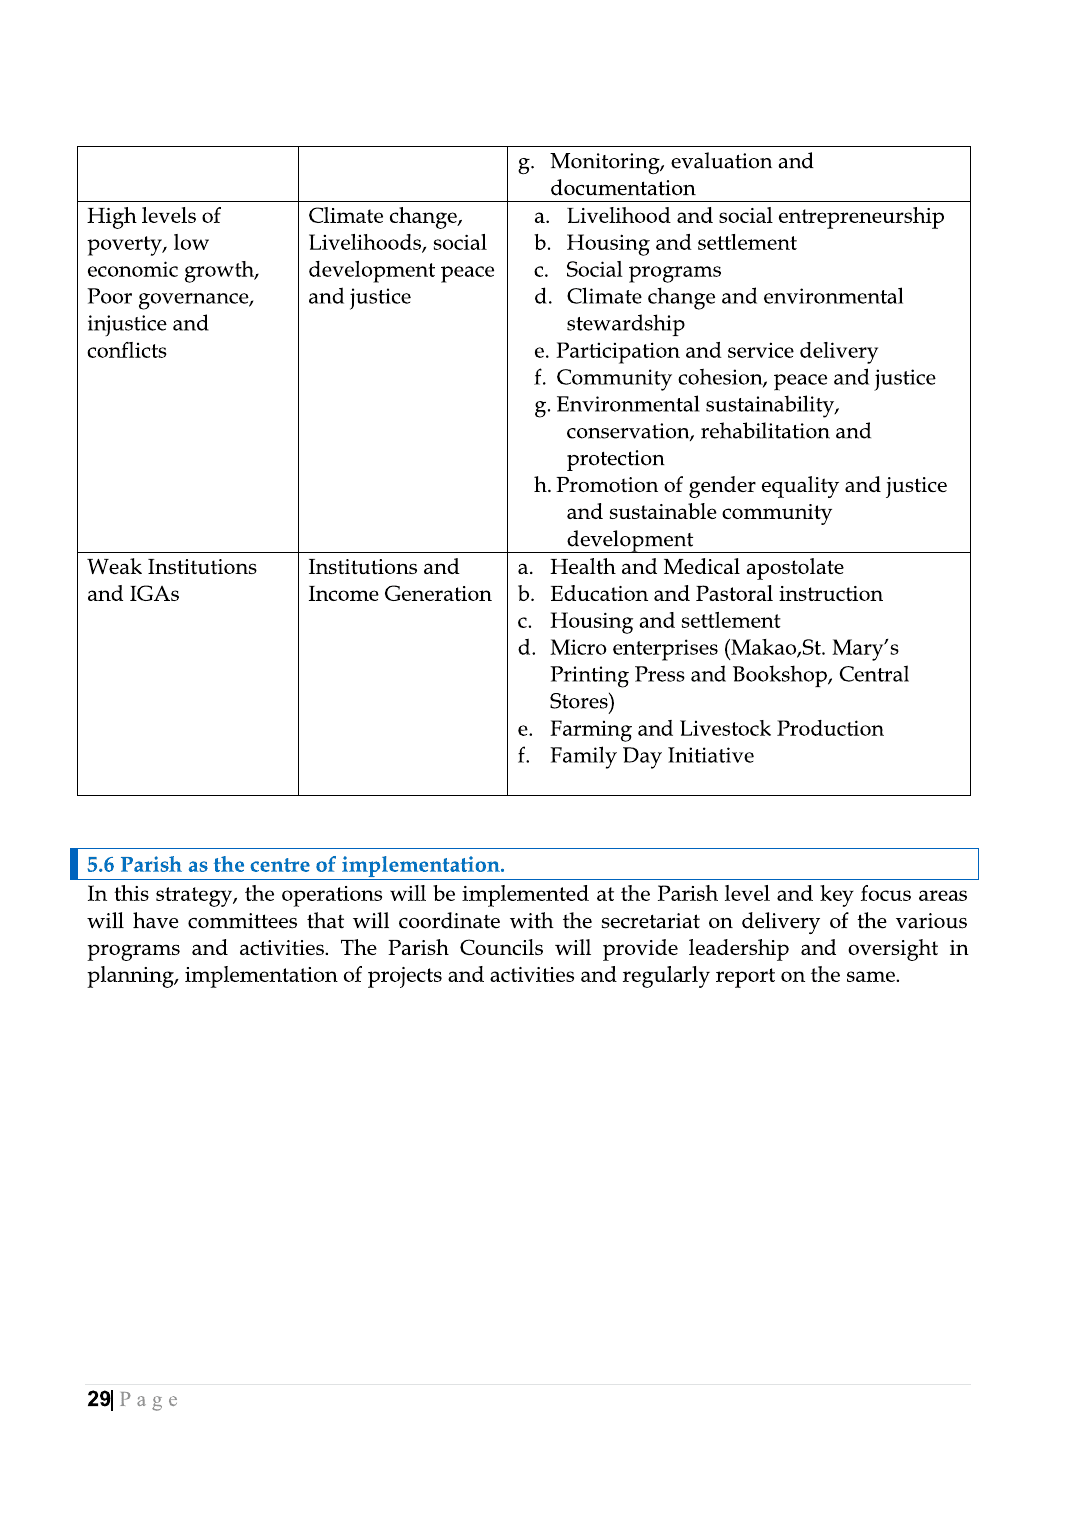
Page 29
Open image
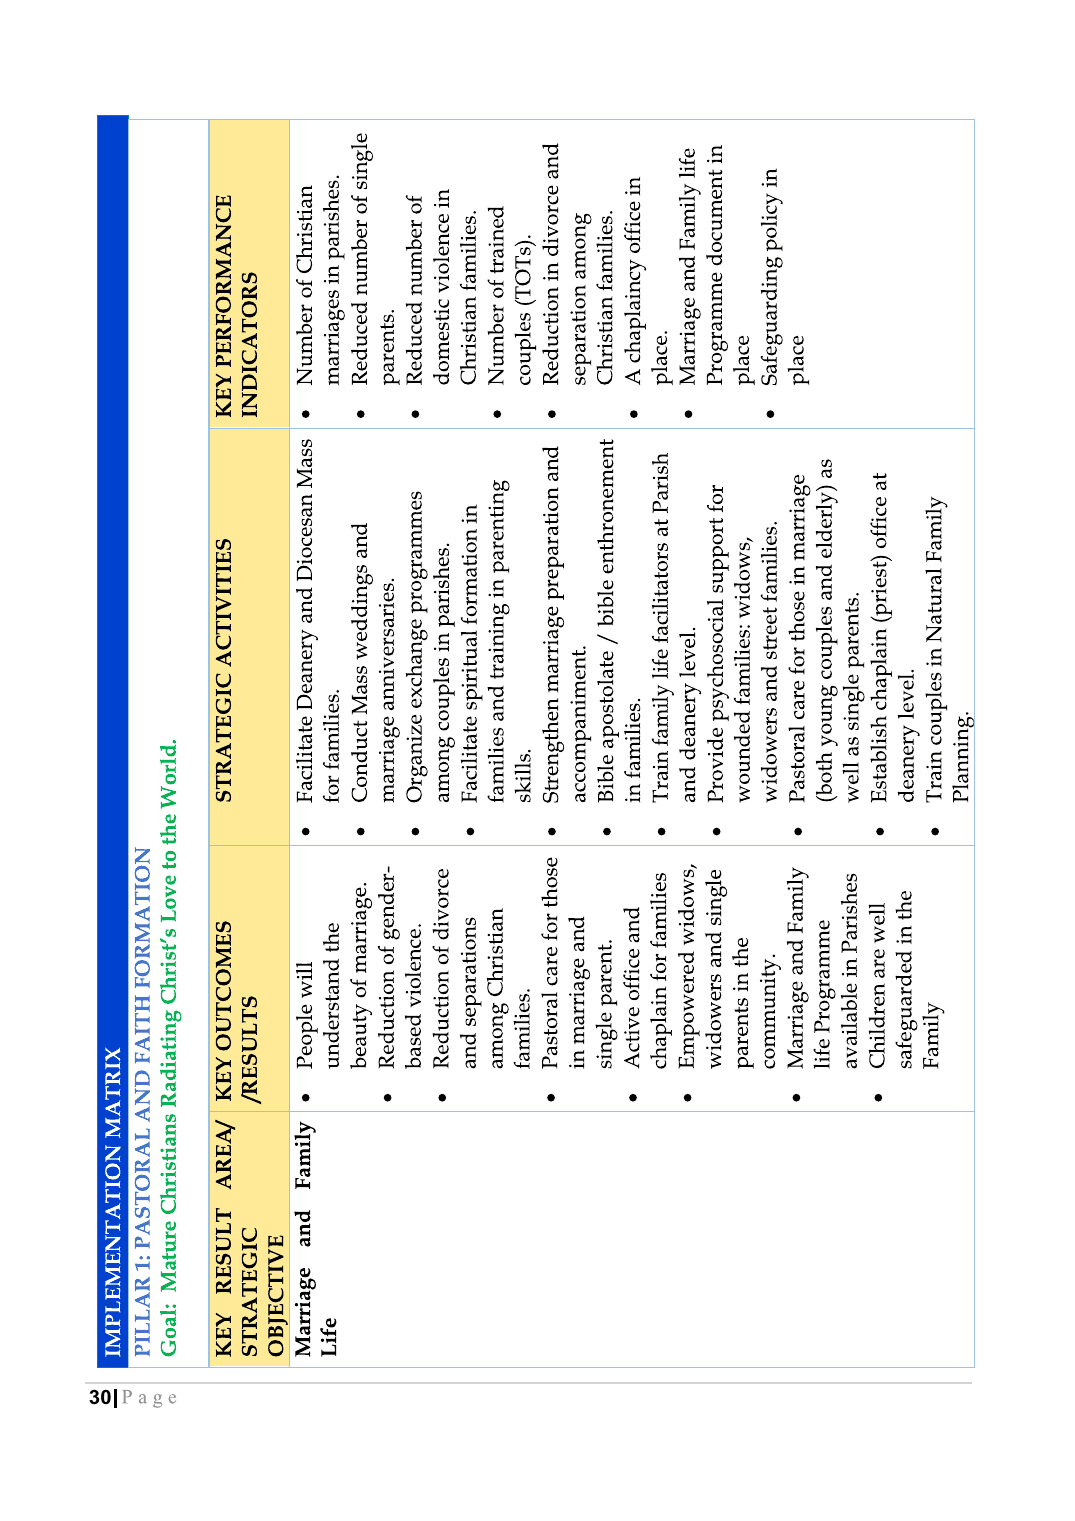
Page 30
Open image
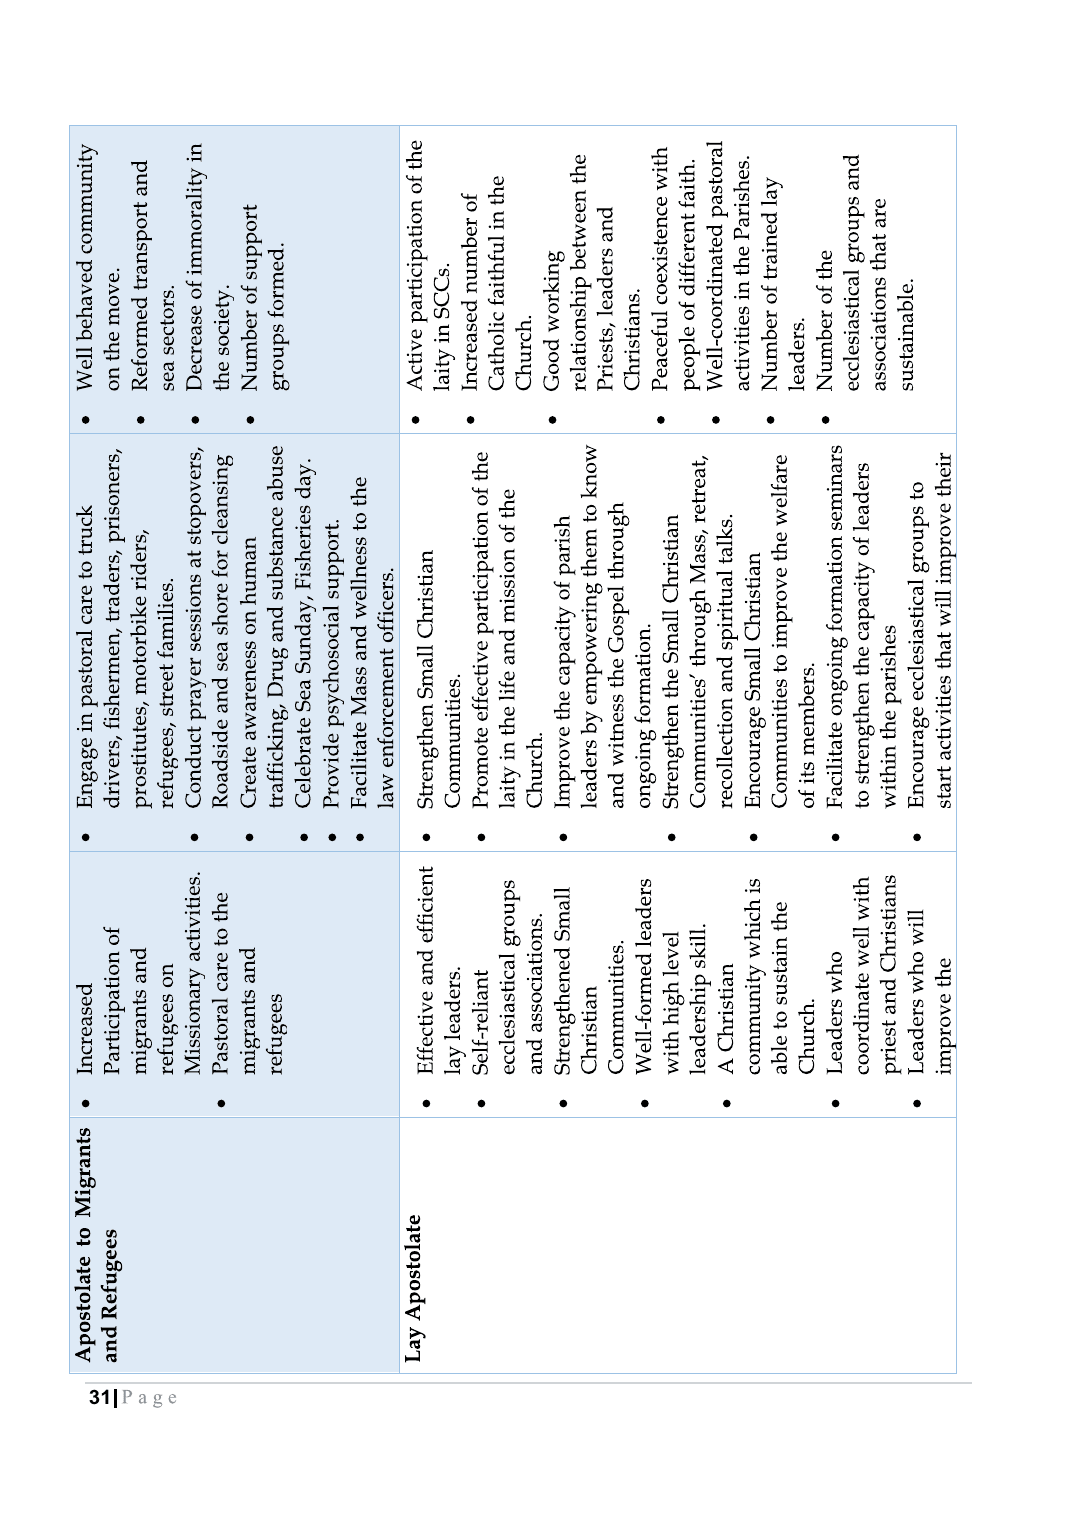
Page 31
Open image
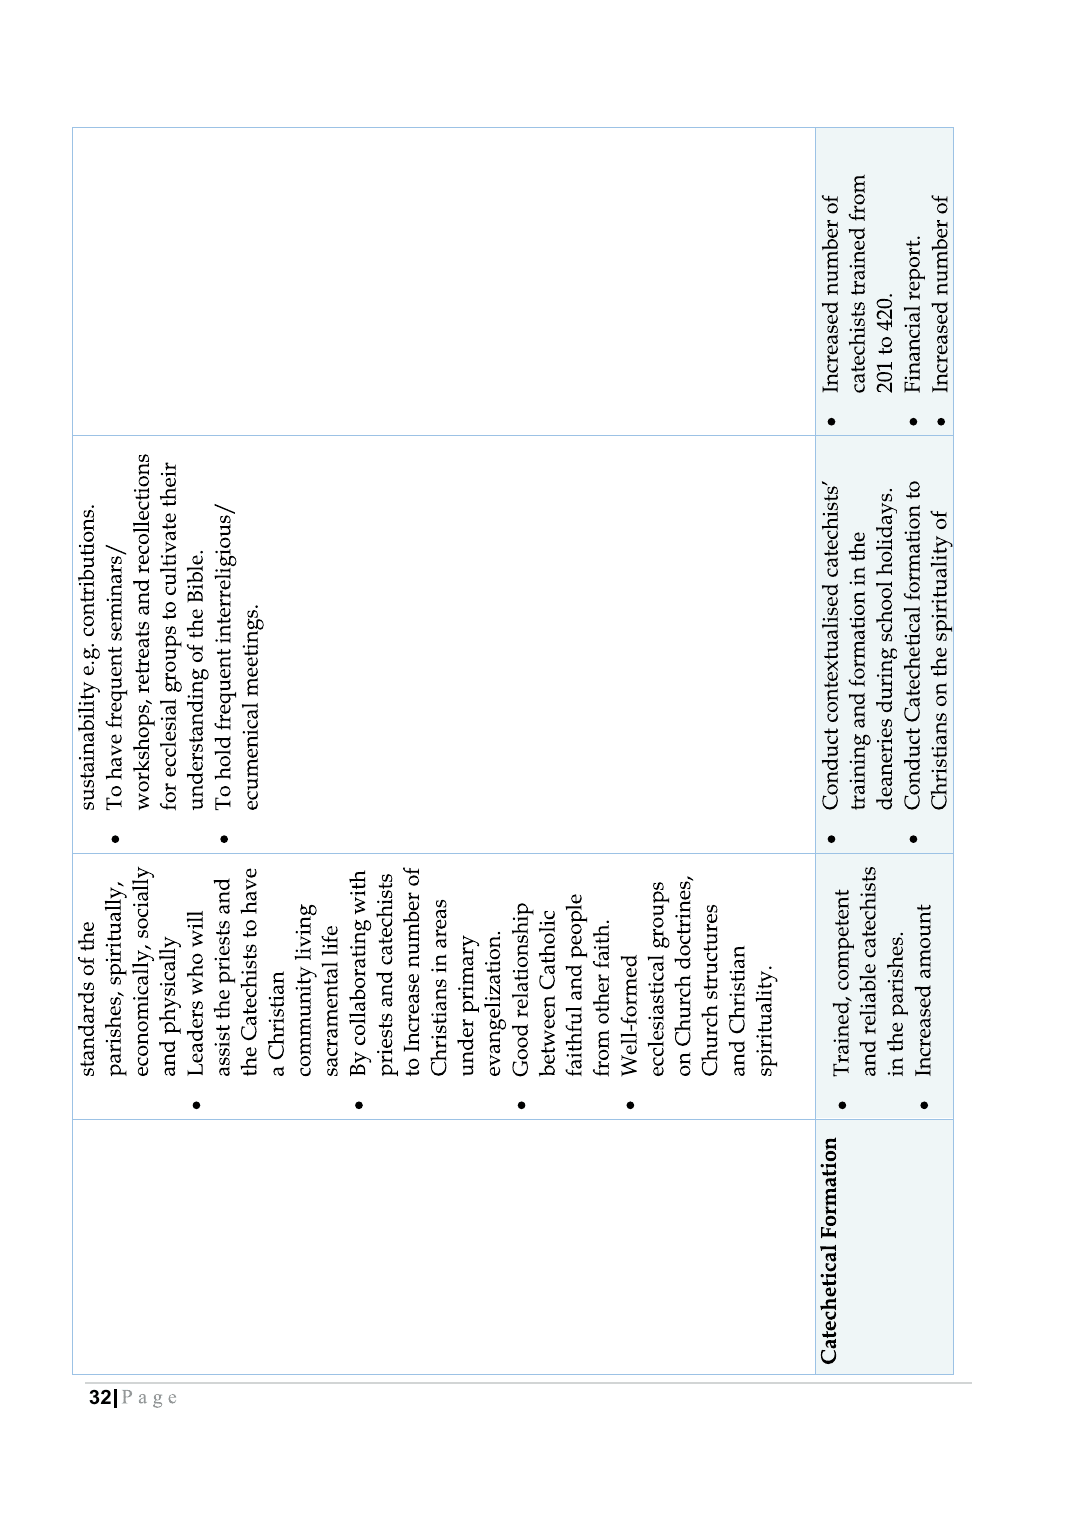
Page 32
Open image
Page 33
Open image
Page 34
Open image
Page 35
Open image
Page 36
Open image
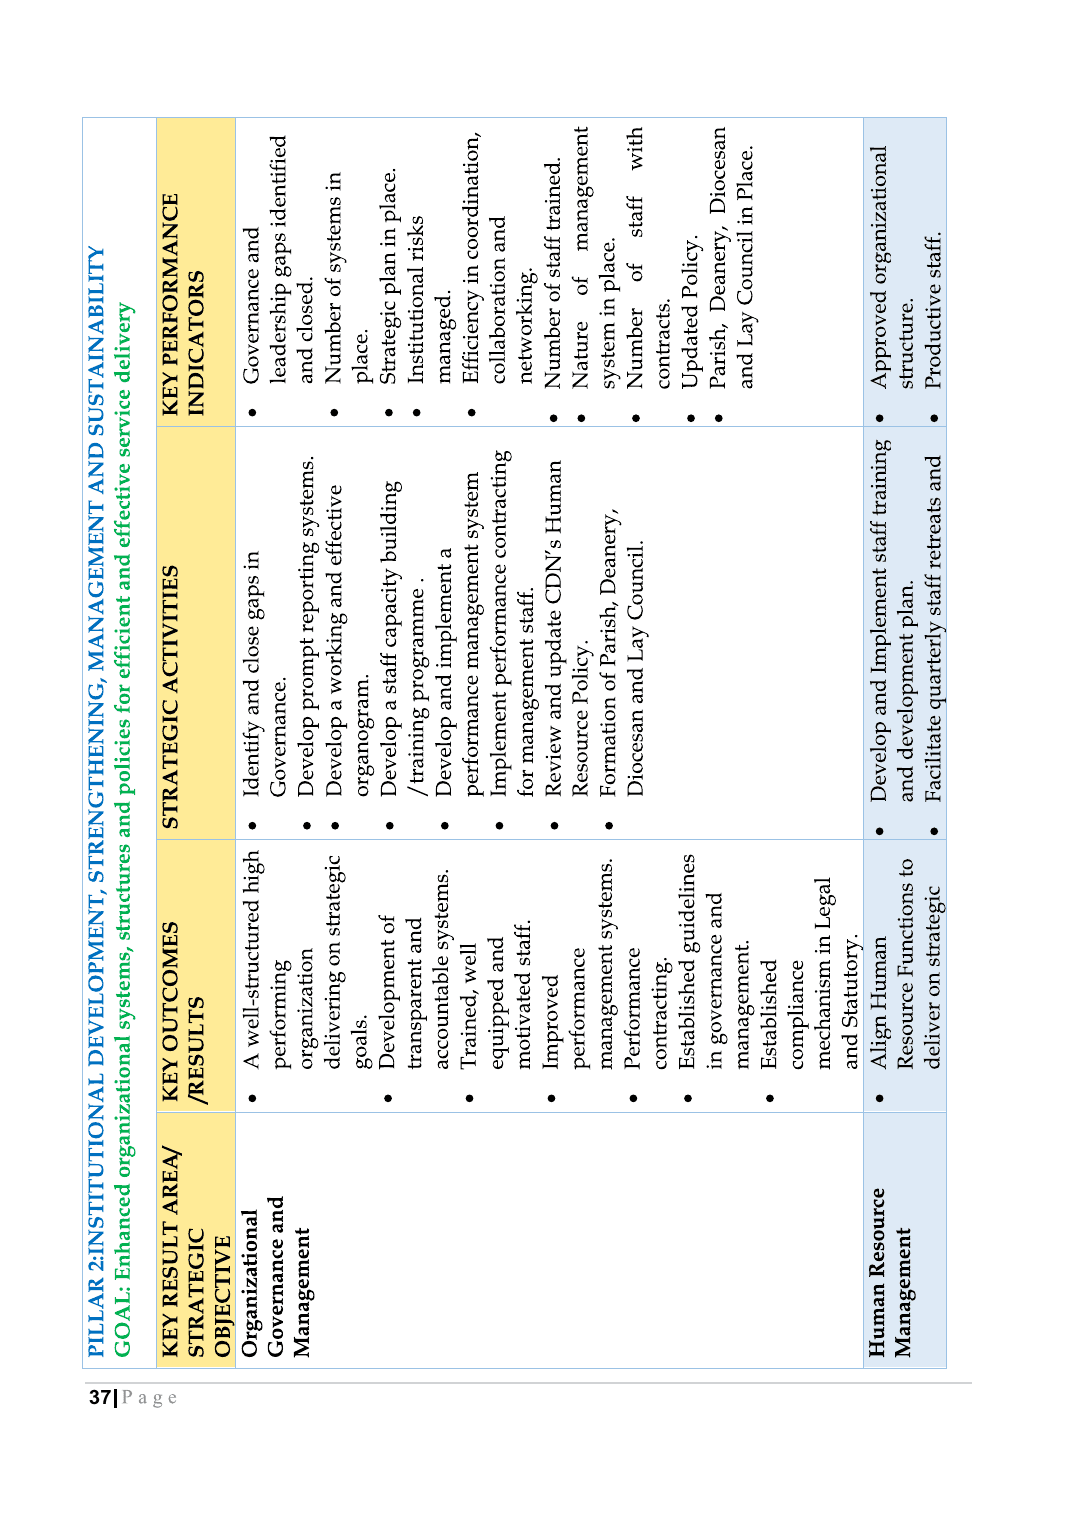
Page 37
Open image
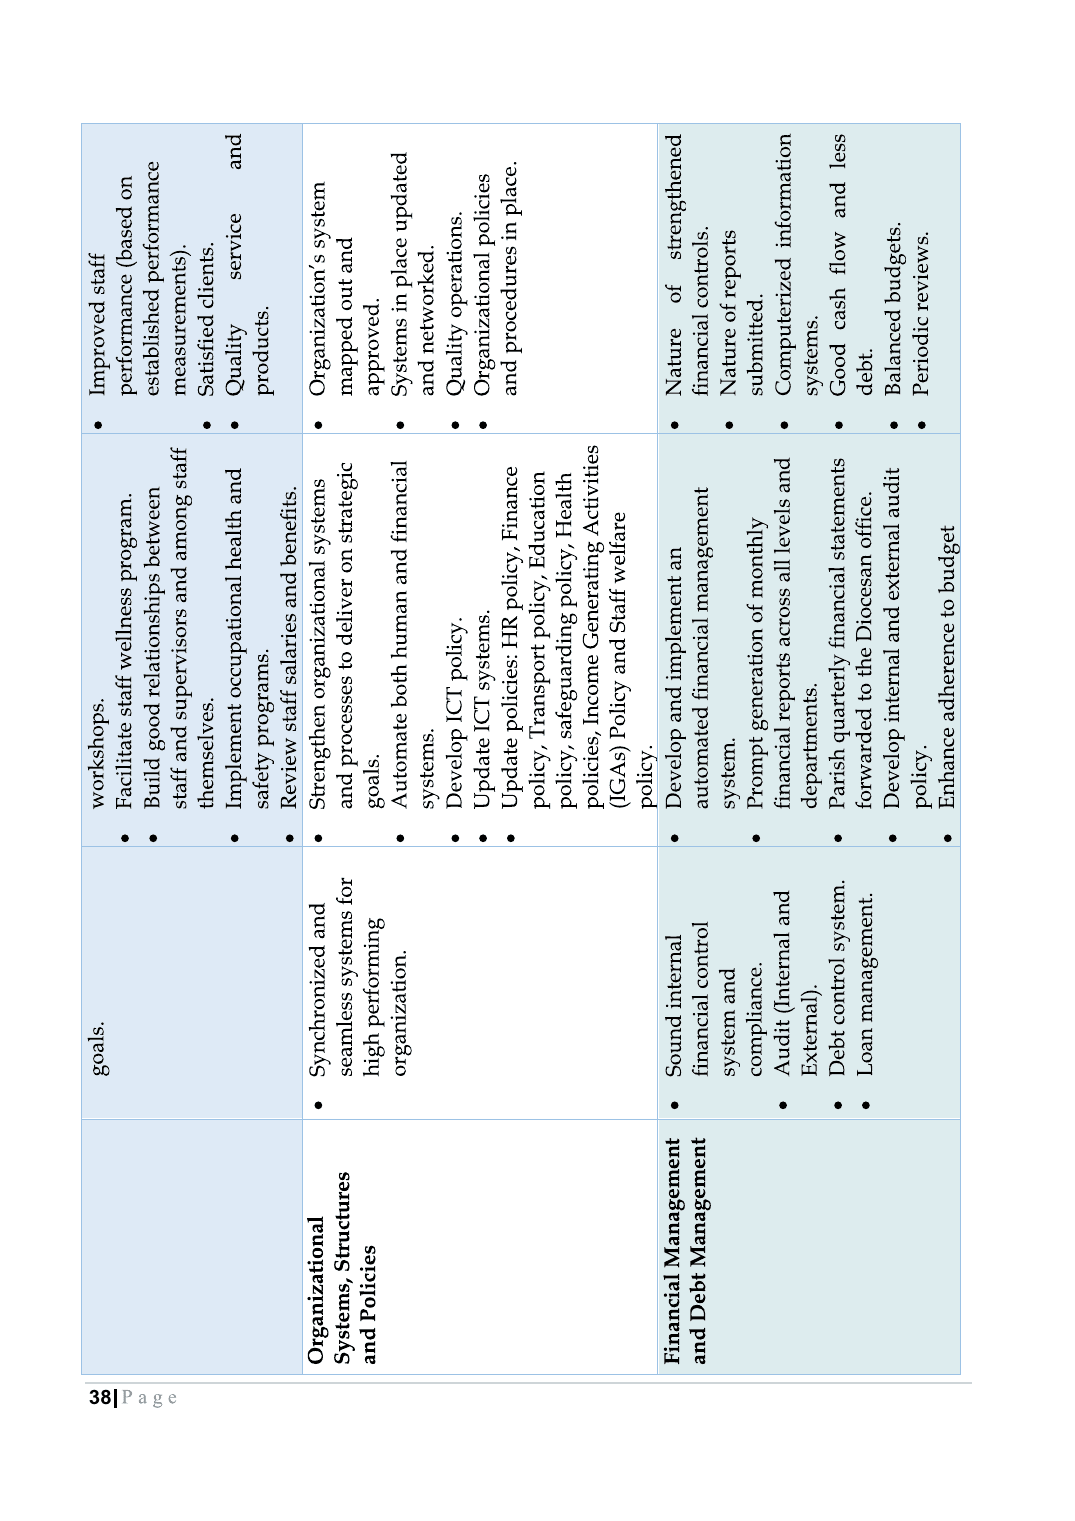
Page 38
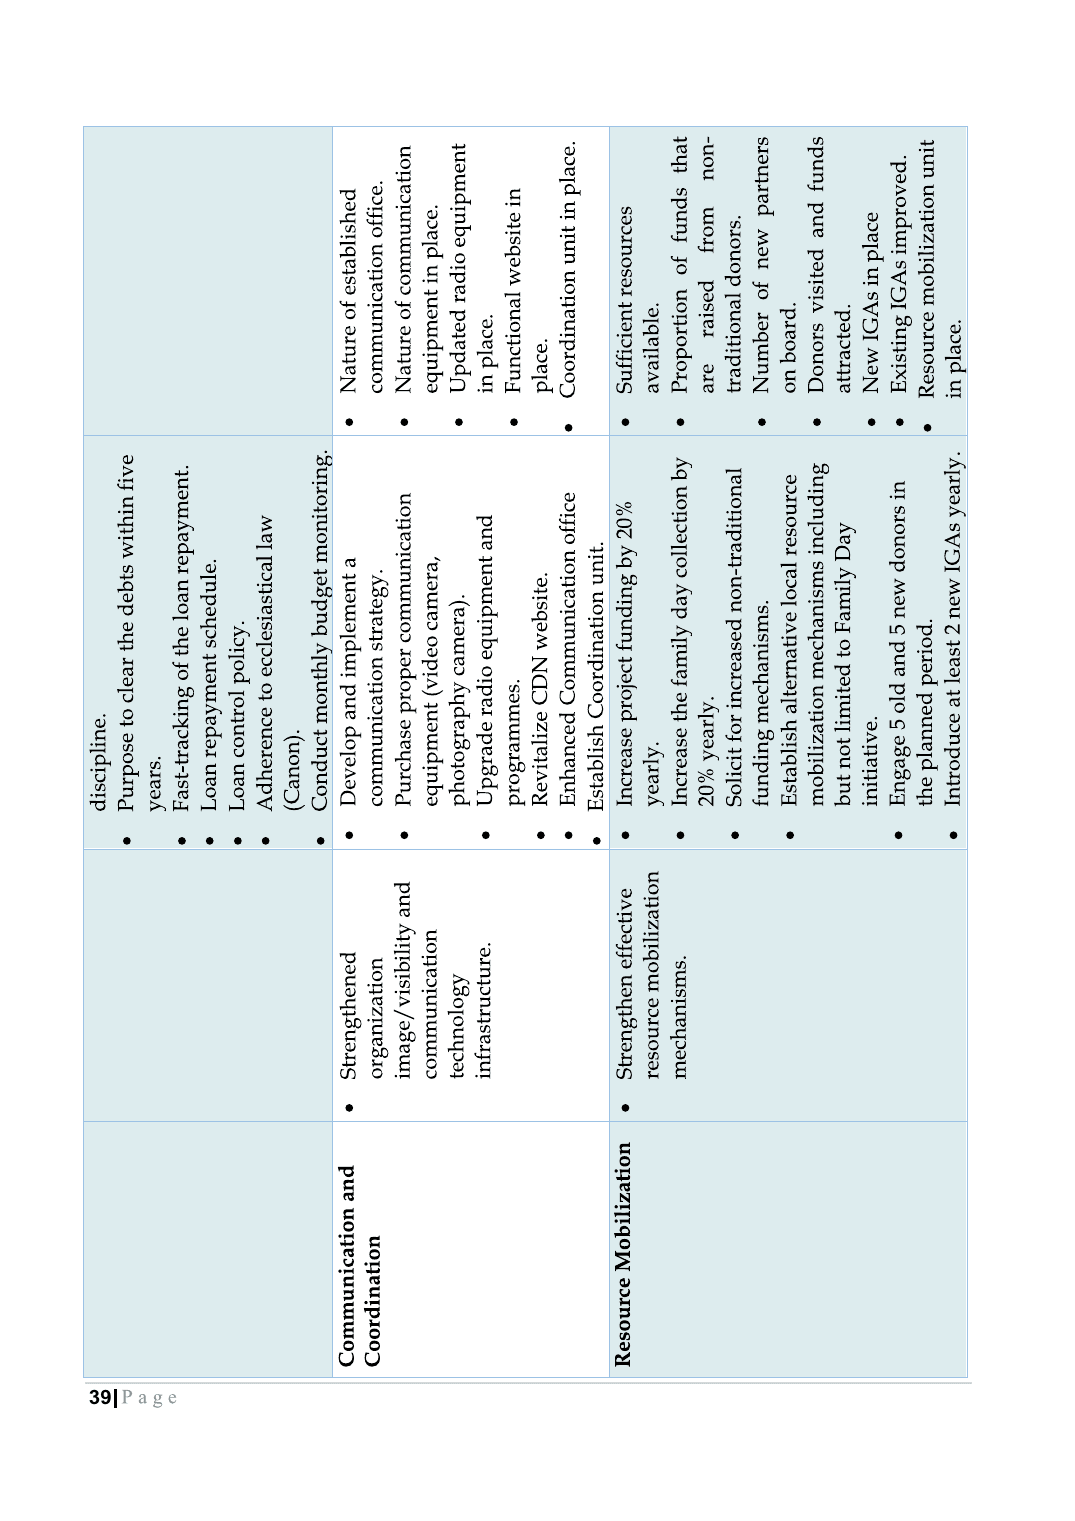
Open image
Page 39
Open image
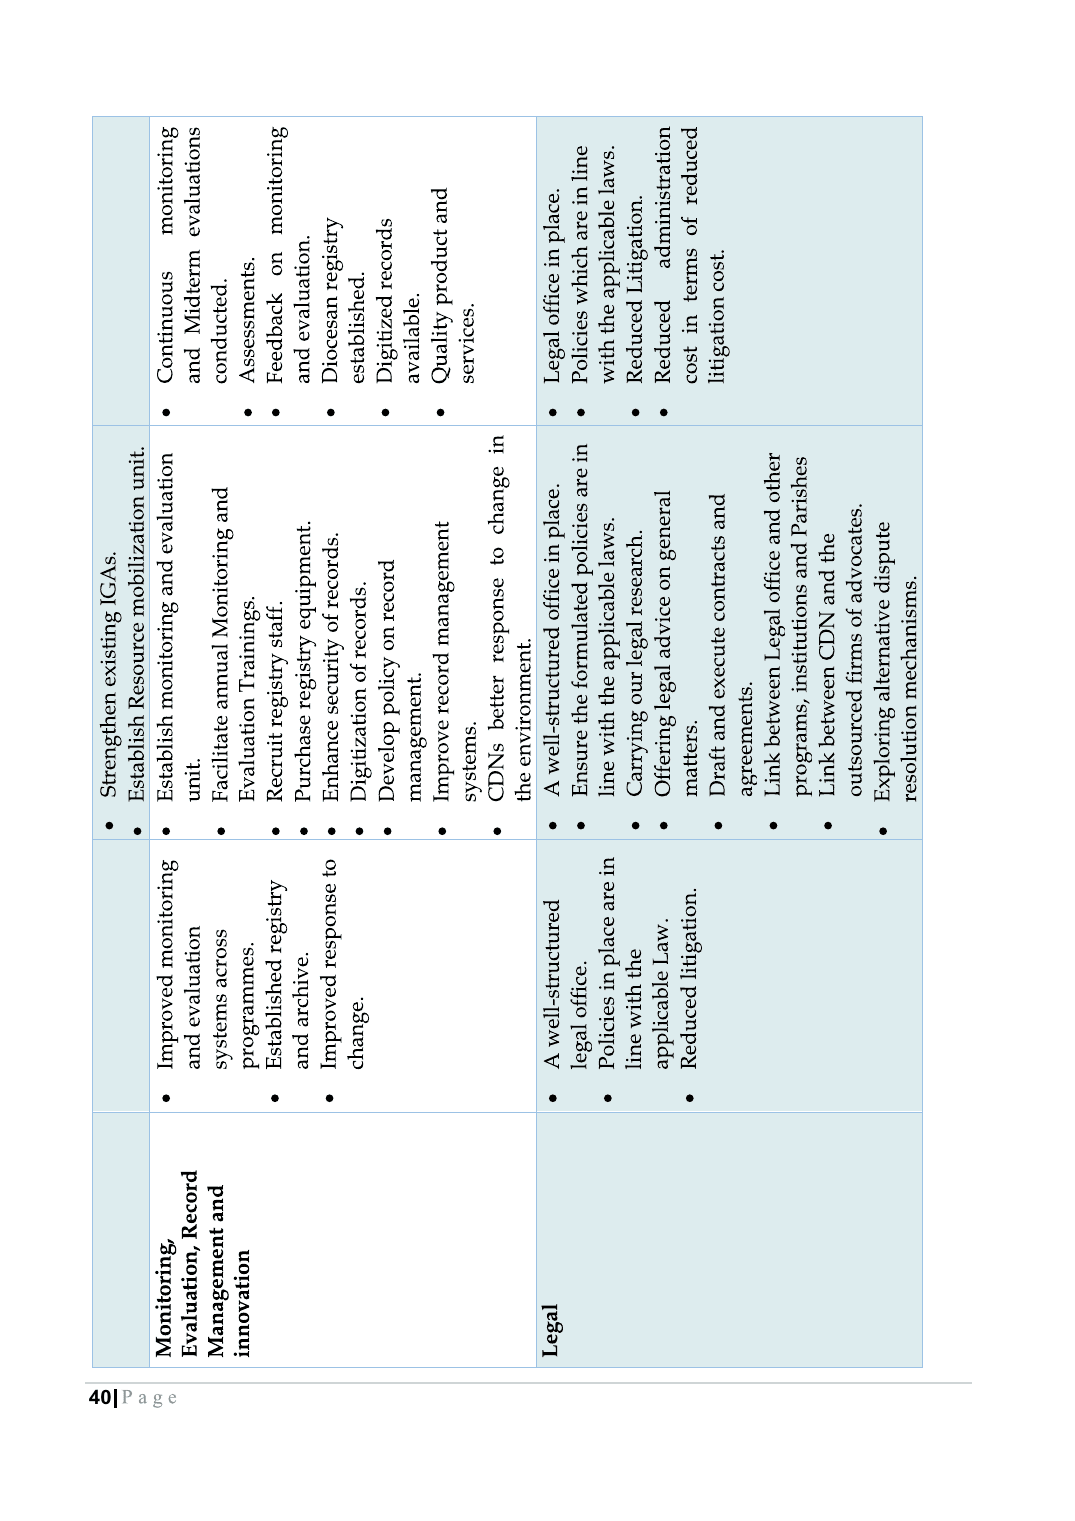
Page 40
Open image
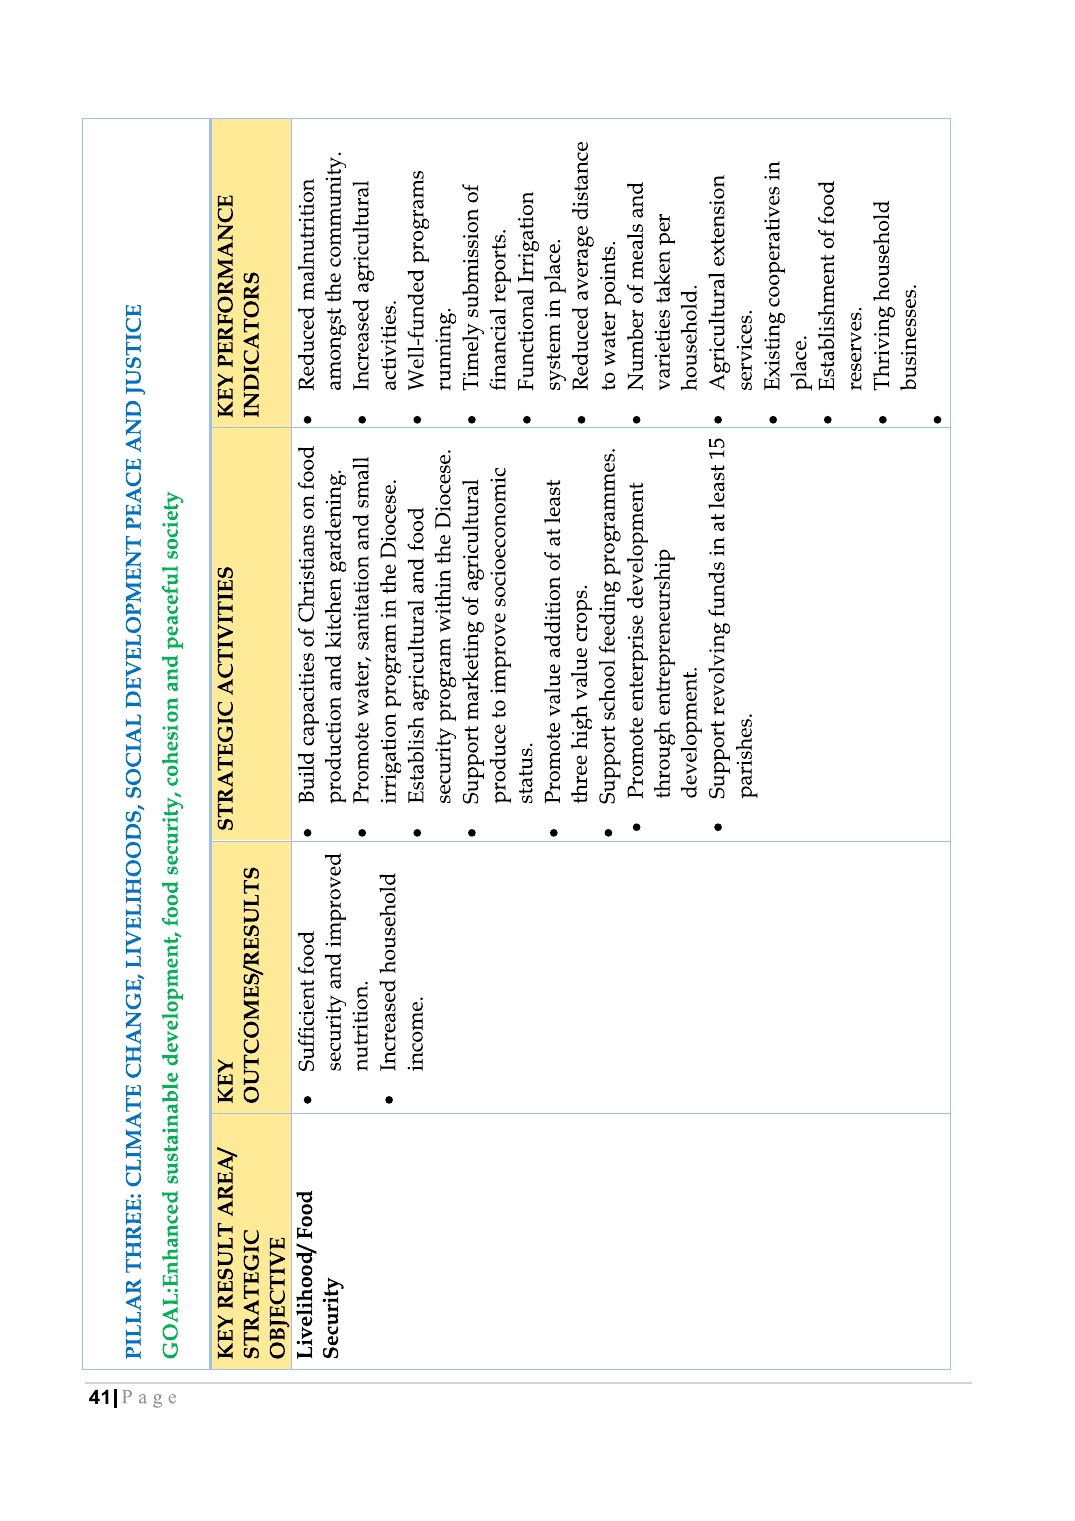
Page 41
Open image
Page 42
Open image
Page 43
Open image
Page 44
Open image
Page 45
Open image
Page 46
Open image
Page 47
Open image
Page 48
Open image
Page 49
Open image
Page 50
Open image
Page 51
Open image
Page 52
Open image
Page 53
Open image
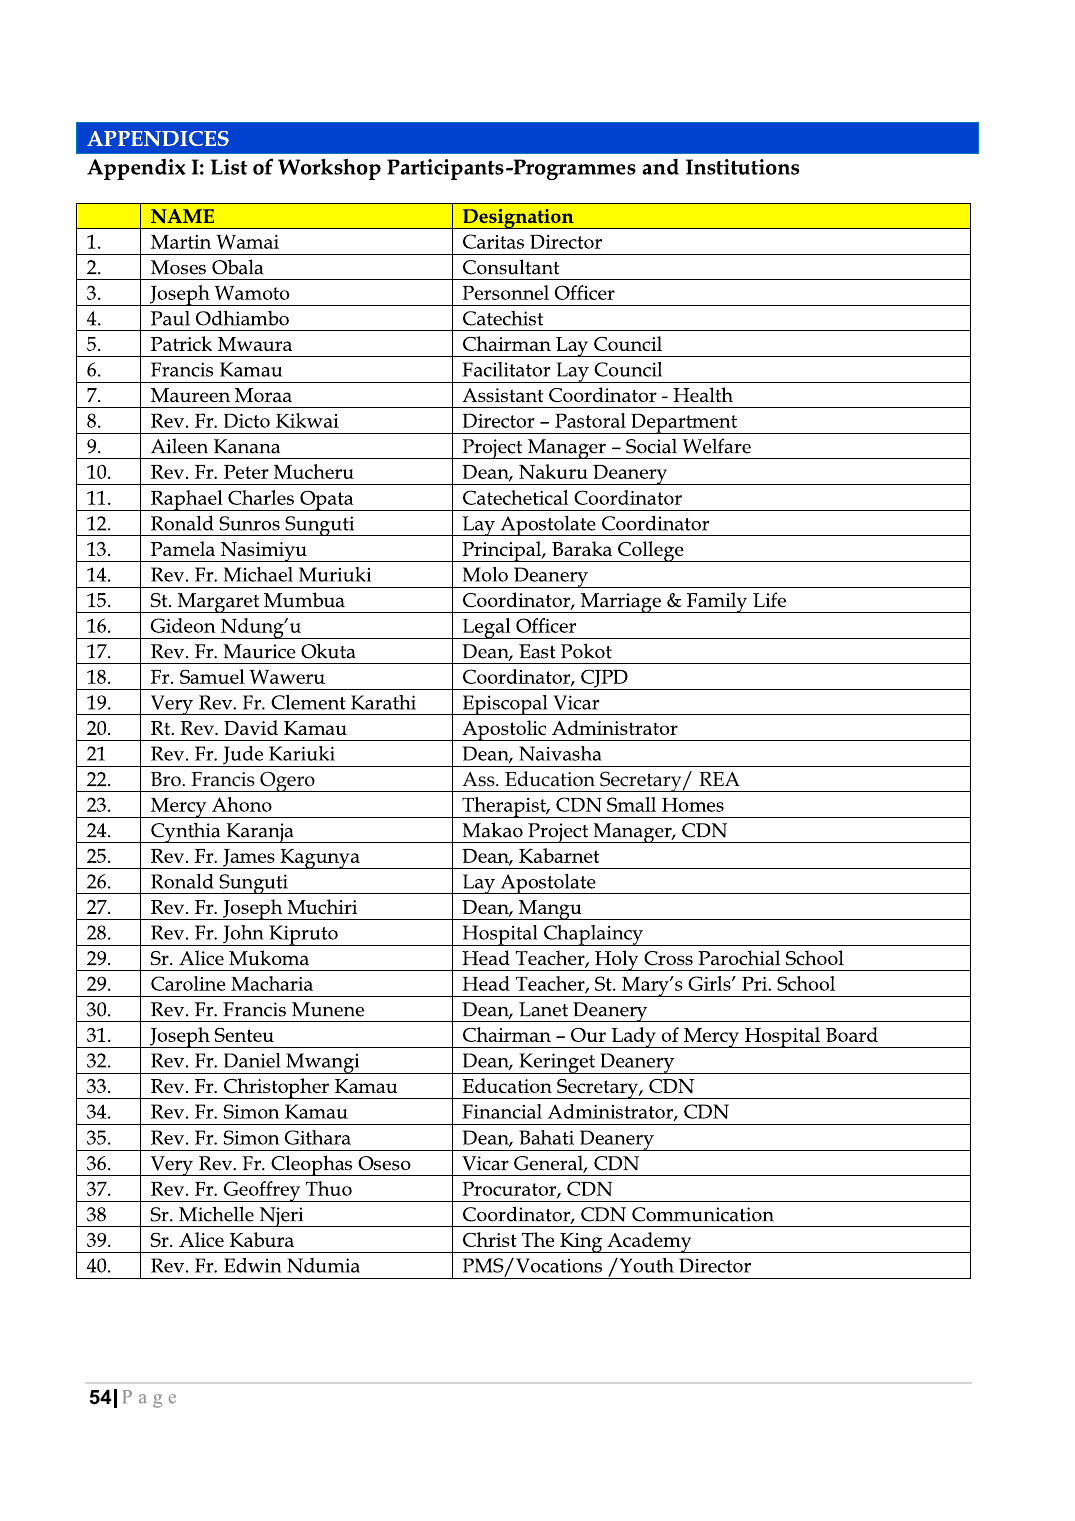
Page 54
Open image
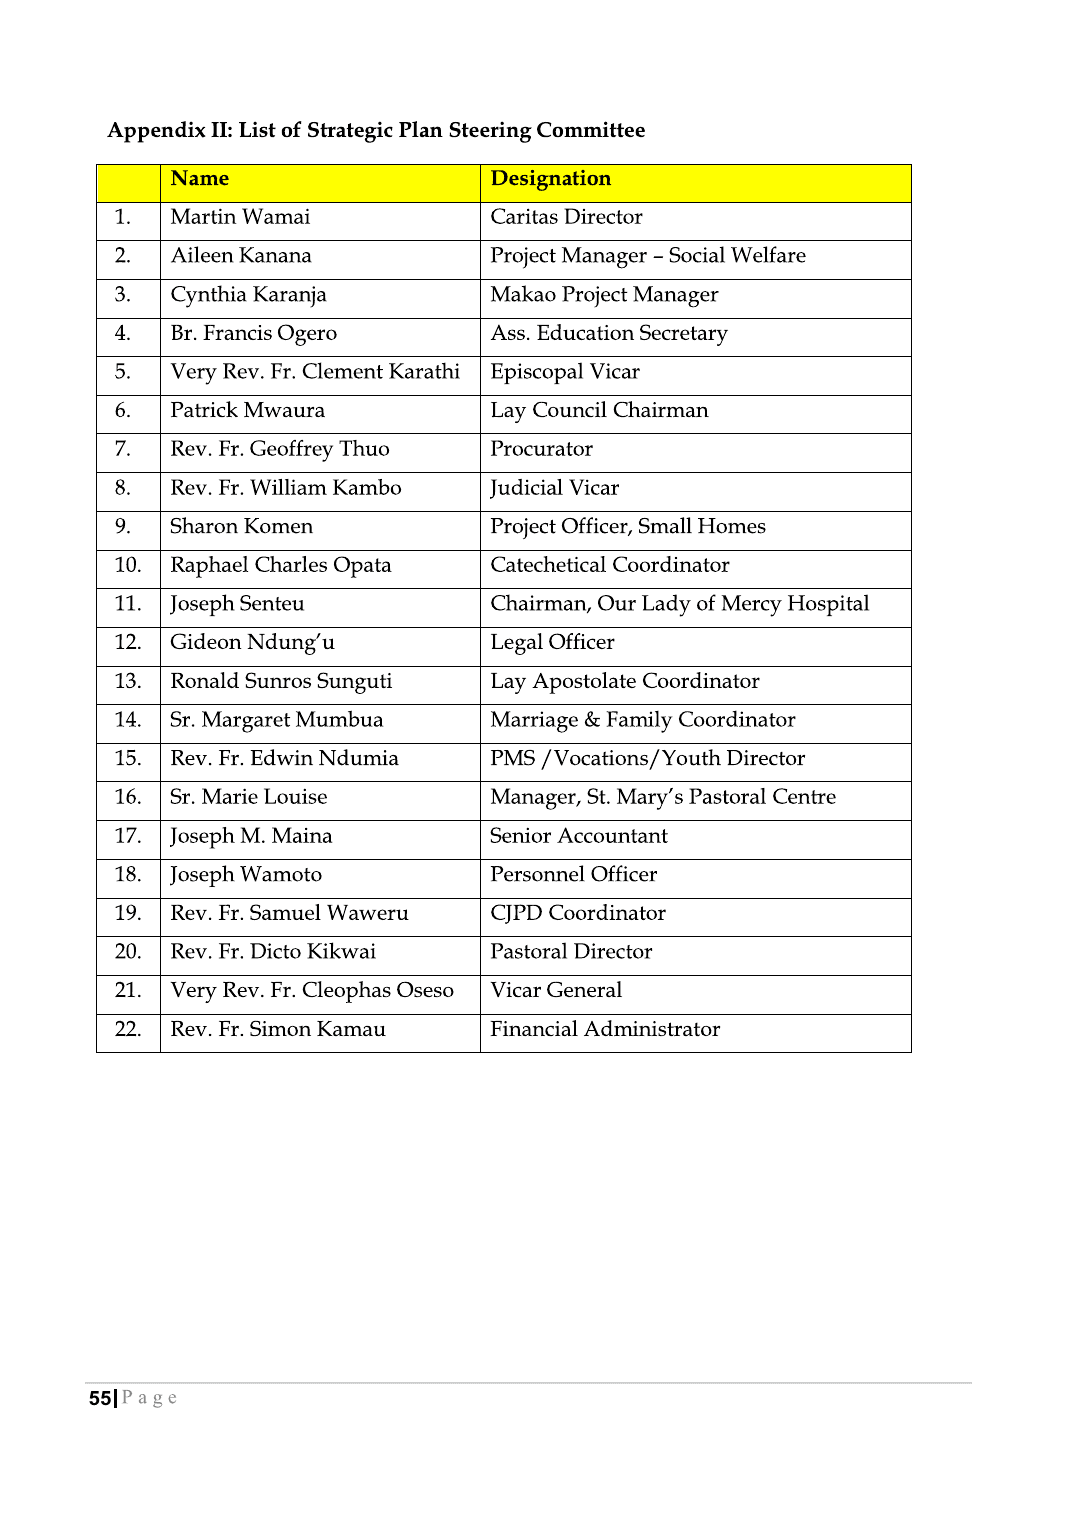
Page 55
Open image
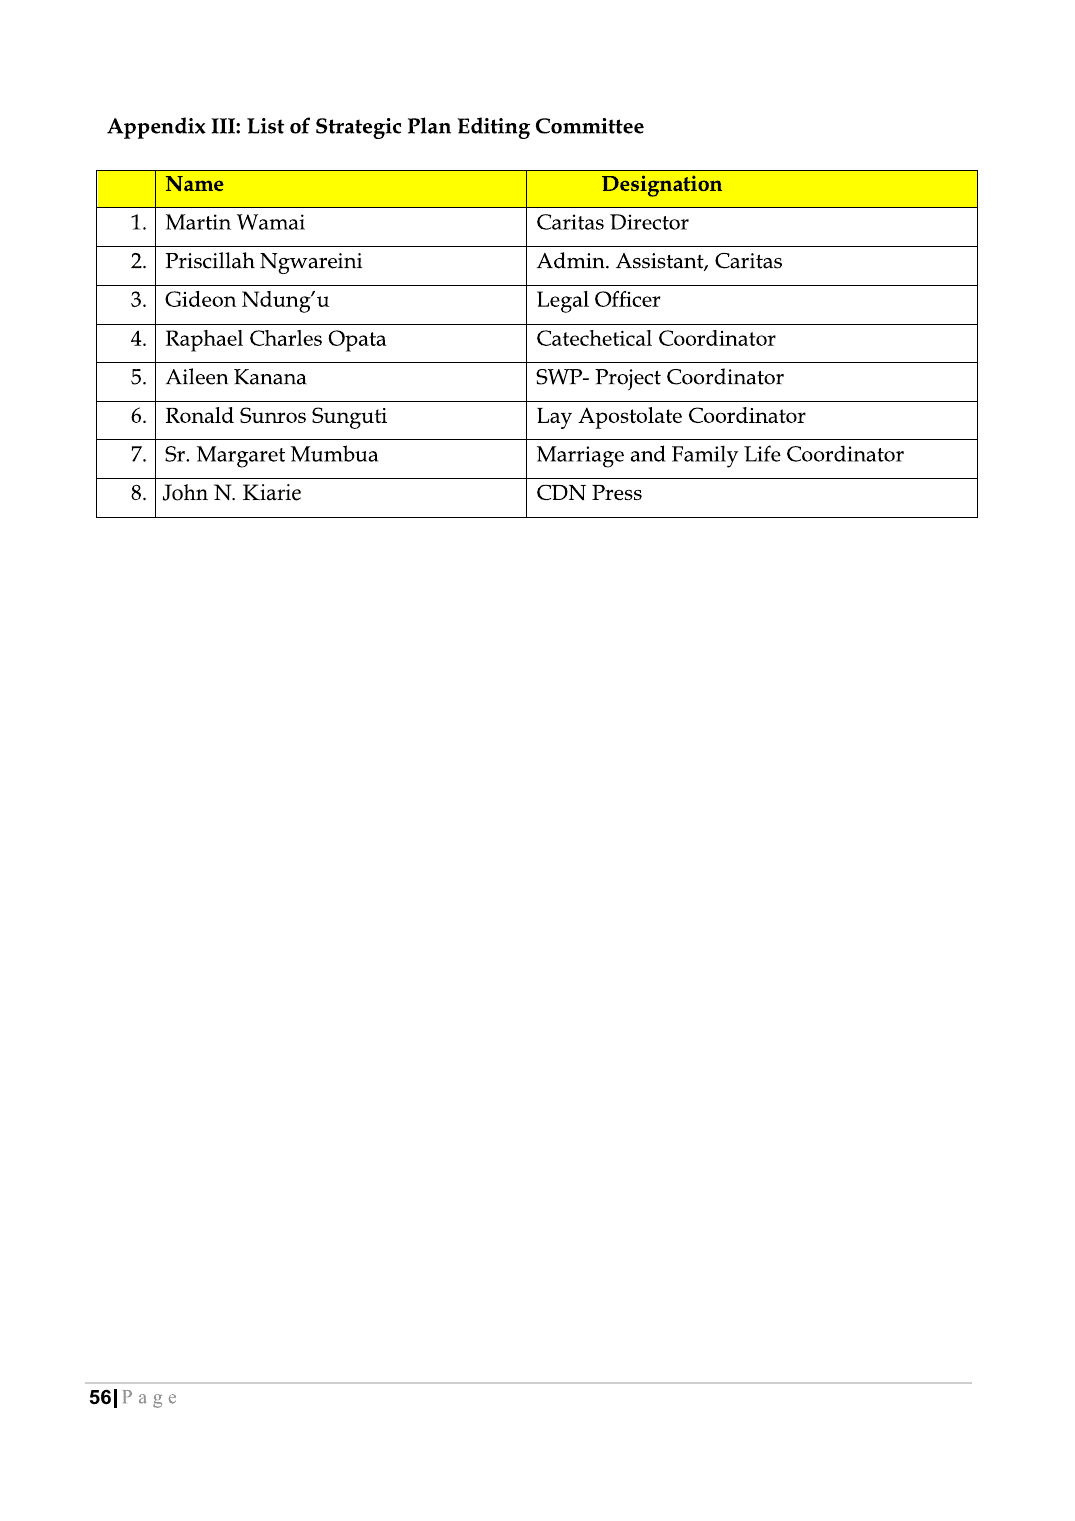
Page 56
Open image